Climate emulator output generation
Contents
14. Climate emulator output generation#
inputs required:
historical wave and water level conditions
emulator output - synthetic wave and water level conditions
in this notebook:
plot the historical and synthetic values of the analyzed variables
generation of hourly values of the synthetic time series
#!/usr/bin/env python
# -*- coding: utf-8 -*-

# common
import os
import os.path as op

# pip
import numpy as np
import xarray as xr
from datetime import datetime
import matplotlib.pyplot as plt

# DEV: override installed teslakit
import sys
sys.path.insert(0, op.join(os.path.abspath(''), '..','..', '..'))

# teslakit
from bluemath.teslakit.util.postprocessing import Generate_HIST_Covariates, Generate_SIM_Covariates
from bluemath.teslakit.plotting.outputs import Plot_Complete
from bluemath.teslakit.util.time_operations import generate_hourly_time, xds_limit_dates
from bluemath.teslakit.waves_emulator import read_hourly_sim
Warning: ecCodes 2.21.0 or higher is recommended. You are running version 2.20.0
14.1. Files and paths#
# project path
p_data = '/Users/albacid/Projects/TeslaKit.2.0_projects/SAMOA'

p_sim = op.join(p_data,'SIMULATION','climate_emulator','WAVES_TCs',)
p_out = op.join(p_data,'OUTPUTS')
if not os.path.isdir(p_out): os.makedirs(p_out)

# historical inputs
AWT_his_file = op.join(p_data, 'SST', 'SST_KMA.nc')
MMSL_his_file = op.join(p_data, 'TIDE', 'tide_mmsl_hist.nc')
MJO_his_file = op.join(p_data, 'resources', 'MJO_hist.nc')
DWT_his_file = op.join(p_data, 'ESTELA', 'pred_slp_grd', 'kma.nc')
AT_his_file = op.join(p_data, 'TIDE', 'tide_astro_hist_h401b.nc')
WVS_his_file = op.join(p_data, 'WAVES', 'bulk_params_wcut_1e-11_TCs.nc')
IB_his_file = op.join(p_data, 'TIDE', 'IB_TCs_daily_his.nc')

# simulation inputs
AWT_sim_file = op.join(p_data, 'SST', 'SST_AWT_sim.nc')
MMSL_sim_file = op.join(p_data, 'TIDE', 'tide_mmsl_sim.nc')
MJO_sim_file = op.join(p_data, 'MJO', 'MJO_sim.nc')
DWT_sim_file = op.join(p_data, 'ESTELA', 'DWT_sim.nc')
AT_sim_file = op.join(p_data, 'TIDE', 'tide_astro_sim_h401b.nc')
IB_sim_file = op.join(p_data, 'TIDE', 'IB_TCs_daily_sim.nc')

# output files
out_his_file = op.join(p_out, 'hourly_his_TCs.nc')

# number of sims
n_sims_DWTs = 100
14.2. Historical Waves and Climate Data#
def AWL(hs, tp):
    'Returns Atmospheric Water Level'

    return 0.043*(hs*1.56*(tp/1.25)**2)**(0.5)
# generate historical covariates hourly data (AWT, MJO, DWT, MMSL, AT)
AWT_his = xr.open_dataset(AWT_his_file)
MMSL_his = xr.open_dataset(MMSL_his_file)
MJO_his = xr.open_dataset(MJO_his_file)
DWT_his = xr.open_dataset(DWT_his_file)
AT_his = xr.open_dataset(AT_his_file)
IB_his = xr.open_dataset(IB_his_file)

CVS = Generate_HIST_Covariates(AWT_his,MMSL_his,MJO_his,DWT_his,AT_his,IB_his)

print(CVS)
<xarray.Dataset>
Dimensions:    (time: 1232353)
Coordinates:
  * time       (time) datetime64[ns] 1880-06-01 ... 2021-01-01
    longitude  float32 ...
    latitude   float32 ...
Data variables:
    AT         (time) float64 nan nan nan nan nan nan ... nan nan nan nan nan
    AWT        (time) float64 5.0 5.0 5.0 5.0 5.0 5.0 ... nan nan nan nan nan
    DWT        (time) float64 nan nan nan nan nan ... 13.0 13.0 13.0 13.0 13.0
    MJO        (time) float64 nan nan nan nan nan nan ... nan nan nan nan nan
    MMSL       (time) float64 nan nan nan nan nan nan ... nan nan nan nan nan
    SS         (time) float64 nan nan nan nan ... 0.0005822 0.0005822 0.003318
Attributes:
    source:   teslakit_v2.0
# load historical waves
WVS_his = xr.open_dataset(WVS_his_file)

WVS_his = WVS_his.drop_vars(['dspr','tm02']).rename({'hs':'Hs','tp':'Tp','dpm':'Dir'})

print(WVS_his)
<xarray.Dataset>
Dimensions:  (time: 365977)
Coordinates:
  * time     (time) datetime64[ns] 1979-01-01 1979-01-01T01:00:00 ... 2020-10-01
Data variables:
    Hs       (time) float64 ...
    Tp       (time) float64 ...
    Dir      (time) float64 ...
    TC_cat   (time) float64 ...
    TC_id    (time) float64 ...
Attributes:
    standard_name:  sea_surface_wave_significant_height
    units:          m
# Combine historical data
HIST = xr.combine_by_coords([CVS, WVS_his])

# set AT reference level (mean at 0)
HIST['AT'] = HIST['AT'] - np.nanmean(HIST['AT'])

# calculate AWL, TWL and level
HIST['AWL'] = AWL(HIST['Hs'], HIST['Tp'])
HIST['TWL'] = HIST['AWL'] + HIST['SS'] + HIST['AT'] + HIST['MMSL']

# store hourly historical offshore data
HIST.to_netcdf(out_his_file)

print(HIST)
<xarray.Dataset>
Dimensions:    (time: 1232353)
Coordinates:
  * time       (time) datetime64[ns] 1880-06-01 ... 2021-01-01
    longitude  float32 ...
    latitude   float32 ...
Data variables: (12/13)
    AT         (time) float64 nan nan nan nan nan nan ... nan nan nan nan nan
    AWT        (time) float64 5.0 5.0 5.0 5.0 5.0 5.0 ... nan nan nan nan nan
    DWT        (time) float64 nan nan nan nan nan ... 13.0 13.0 13.0 13.0 13.0
    MJO        (time) float64 nan nan nan nan nan nan ... nan nan nan nan nan
    MMSL       (time) float64 nan nan nan nan nan nan ... nan nan nan nan nan
    SS         (time) float64 nan nan nan nan ... 0.0005822 0.0005822 0.003318
    ...         ...
    Tp         (time) float64 nan nan nan nan nan nan ... nan nan nan nan nan
    Dir        (time) float64 nan nan nan nan nan nan ... nan nan nan nan nan
    TC_cat     (time) float64 nan nan nan nan nan nan ... nan nan nan nan nan
    TC_id      (time) float64 nan nan nan nan nan nan ... nan nan nan nan nan
    AWL        (time) float64 nan nan nan nan nan nan ... nan nan nan nan nan
    TWL        (time) float64 nan nan nan nan nan nan ... nan nan nan nan nan
Attributes:
    source:         teslakit_v2.0
    standard_name:  sea_surface_wave_significant_height
    units:          m
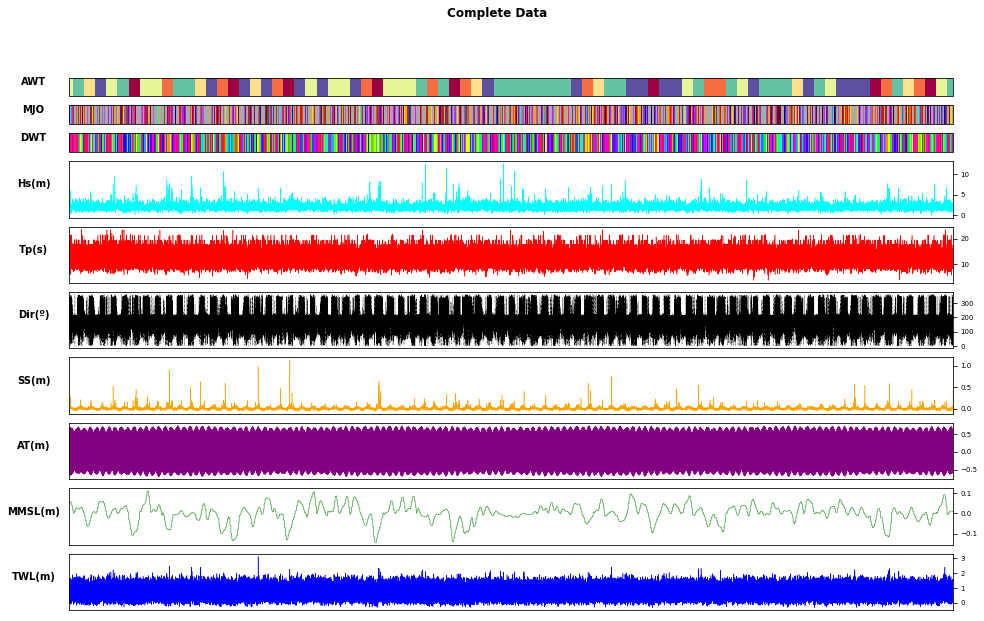
# Plot Historical
Plot_Complete(HIST);
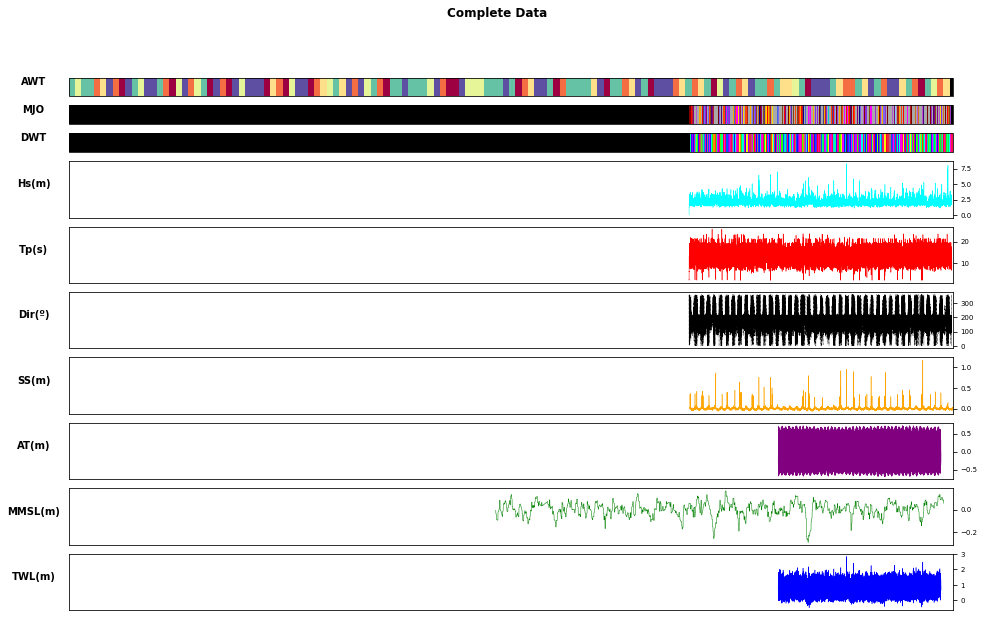
# Plot Historical zoom
HIST_zoom = HIST.copy(deep=True)
HIST_zoom = HIST_zoom.sel(time=slice(datetime(1993,1,1), datetime(2019,1,1)))
Plot_Complete(HIST_zoom);
14.3. Simulated Waves and Climate Data#
# generate simulation covariates hourly data
AWT_sim = xr.open_dataset(AWT_sim_file, decode_times=True)
MMSL_sim = xr.open_dataset(MMSL_sim_file, decode_times=True)
MJO_sim = xr.open_dataset(MJO_sim_file, decode_times=True)
DWT_sim = xr.open_dataset(DWT_sim_file, decode_times=True)
AT_sim = xr.open_dataset(AT_sim_file, decode_times=True)
IB_sim = xr.open_dataset(IB_sim_file, decode_times=True)

CVS = Generate_SIM_Covariates(AWT_sim, MMSL_sim, MJO_sim, DWT_sim, AT_sim, IB_sim, total_sims=n_sims_DWTs)

print(CVS)
<xarray.Dataset>
Dimensions:  (n_sim: 100, time: 701257)
Coordinates:
  * time     (time) datetime64[ns] 2020-01-01 2020-01-01T01:00:00 ... 2099-12-31
Dimensions without coordinates: n_sim
Data variables:
    AWT      (n_sim, time) int64 4 4 4 4 4 4 4 4 4 4 4 ... 1 1 1 1 1 1 1 1 1 1 1
    MJO      (n_sim, time) int64 23 23 23 23 23 23 23 ... 21 21 21 21 21 21 21
    DWT      (n_sim, time) int64 3 3 3 3 3 3 3 3 3 3 3 ... 1 1 1 1 1 1 1 1 1 17
    MMSL     (n_sim, time) float32 0.06437 0.06437 0.06437 ... -0.1205 -0.1205
    AT       (time) float32 0.09214 -0.02483 -0.1358 ... 0.1657 -0.05104 -0.2548
    SS       (n_sim, time) float32 0.09519 0.09519 0.09519 ... 0.06747 0.04888
# iterate simulations
p_sim = '/Volumes/WD/Teslakit.2.0/SAMOA/SIMULATION/climate_emulator/WAVES_TCs'

for n in range(99,n_sims_DWTs):

    # select covariates simulation
    CVS_s = CVS.sel(n_sim=n)

    # load simulated waves
    WVS_sim_file = op.join(p_sim, 'bulk_params_hourly_{0:08d}.nc'.format(int(n)))
    WVS_s = xr.open_dataset(WVS_sim_file)
    WVS_s = WVS_s.sel(time=slice(CVS.time.values[0], CVS.time.values[-1]))
    WVS_s = WVS_s.drop(['dspr','hs']).rename({'hs_corrected':'Hs','tp':'Tp','dpm':'Dir'})

    # merge all data
    SIM = xr.combine_by_coords([WVS_s, CVS_s])

    # set AT reference level (mean at 0)
    SIM['AT'].values[:] = SIM['AT'] - np.nanmean(SIM['AT'])

    # calculate AWL, TWL and level
    SIM['AWL'] = AWL(SIM['Hs'], SIM['Tp'])
    SIM['TWL'] = SIM['AWL'] + SIM['SS'] + SIM['AT'] + SIM['MMSL']

    # store hourly simulation offshore data
    SIM.to_netcdf(op.join(p_out, 'hourly_sim_TCs_{0:08d}.nc'.format(int(n))))

    print('simulation {0} processed.'.format(n))
simulation 99 processed.
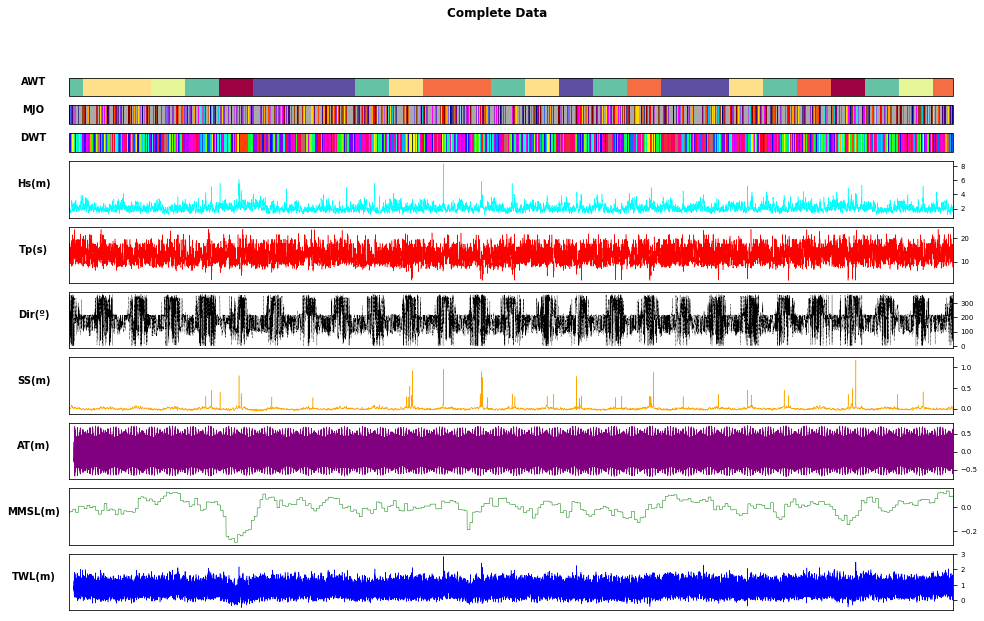
# Plot one Simulation

n_sim = 6

SIM_p = xr.open_dataset(op.join(p_out, 'hourly_sim_TCs_{0:08d}.nc'.format(int(n_sim))))
print(SIM_p)

Plot_Complete(SIM_p);
<xarray.Dataset>
Dimensions:  (time: 701257)
Coordinates:
  * time     (time) datetime64[ns] 2020-01-01 2020-01-01T01:00:00 ... 2099-12-31
Data variables: (12/15)
    AWT      (time) int64 ...
    MJO      (time) int64 ...
    DWT      (time) int64 ...
    MMSL     (time) float32 ...
    AT       (time) float32 ...
    SS       (time) float32 ...
    ...       ...
    TC_cat   (time) float32 ...
    TC_id    (time) float32 ...
    TC_type  (time) float32 ...
    Hs       (time) float32 ...
    AWL      (time) float32 ...
    TWL      (time) float32 ...
Attributes:
    standard_name:  sea_surface_wave_significant_height
    units:          m