Historical waves
Contents
6. Historical waves#
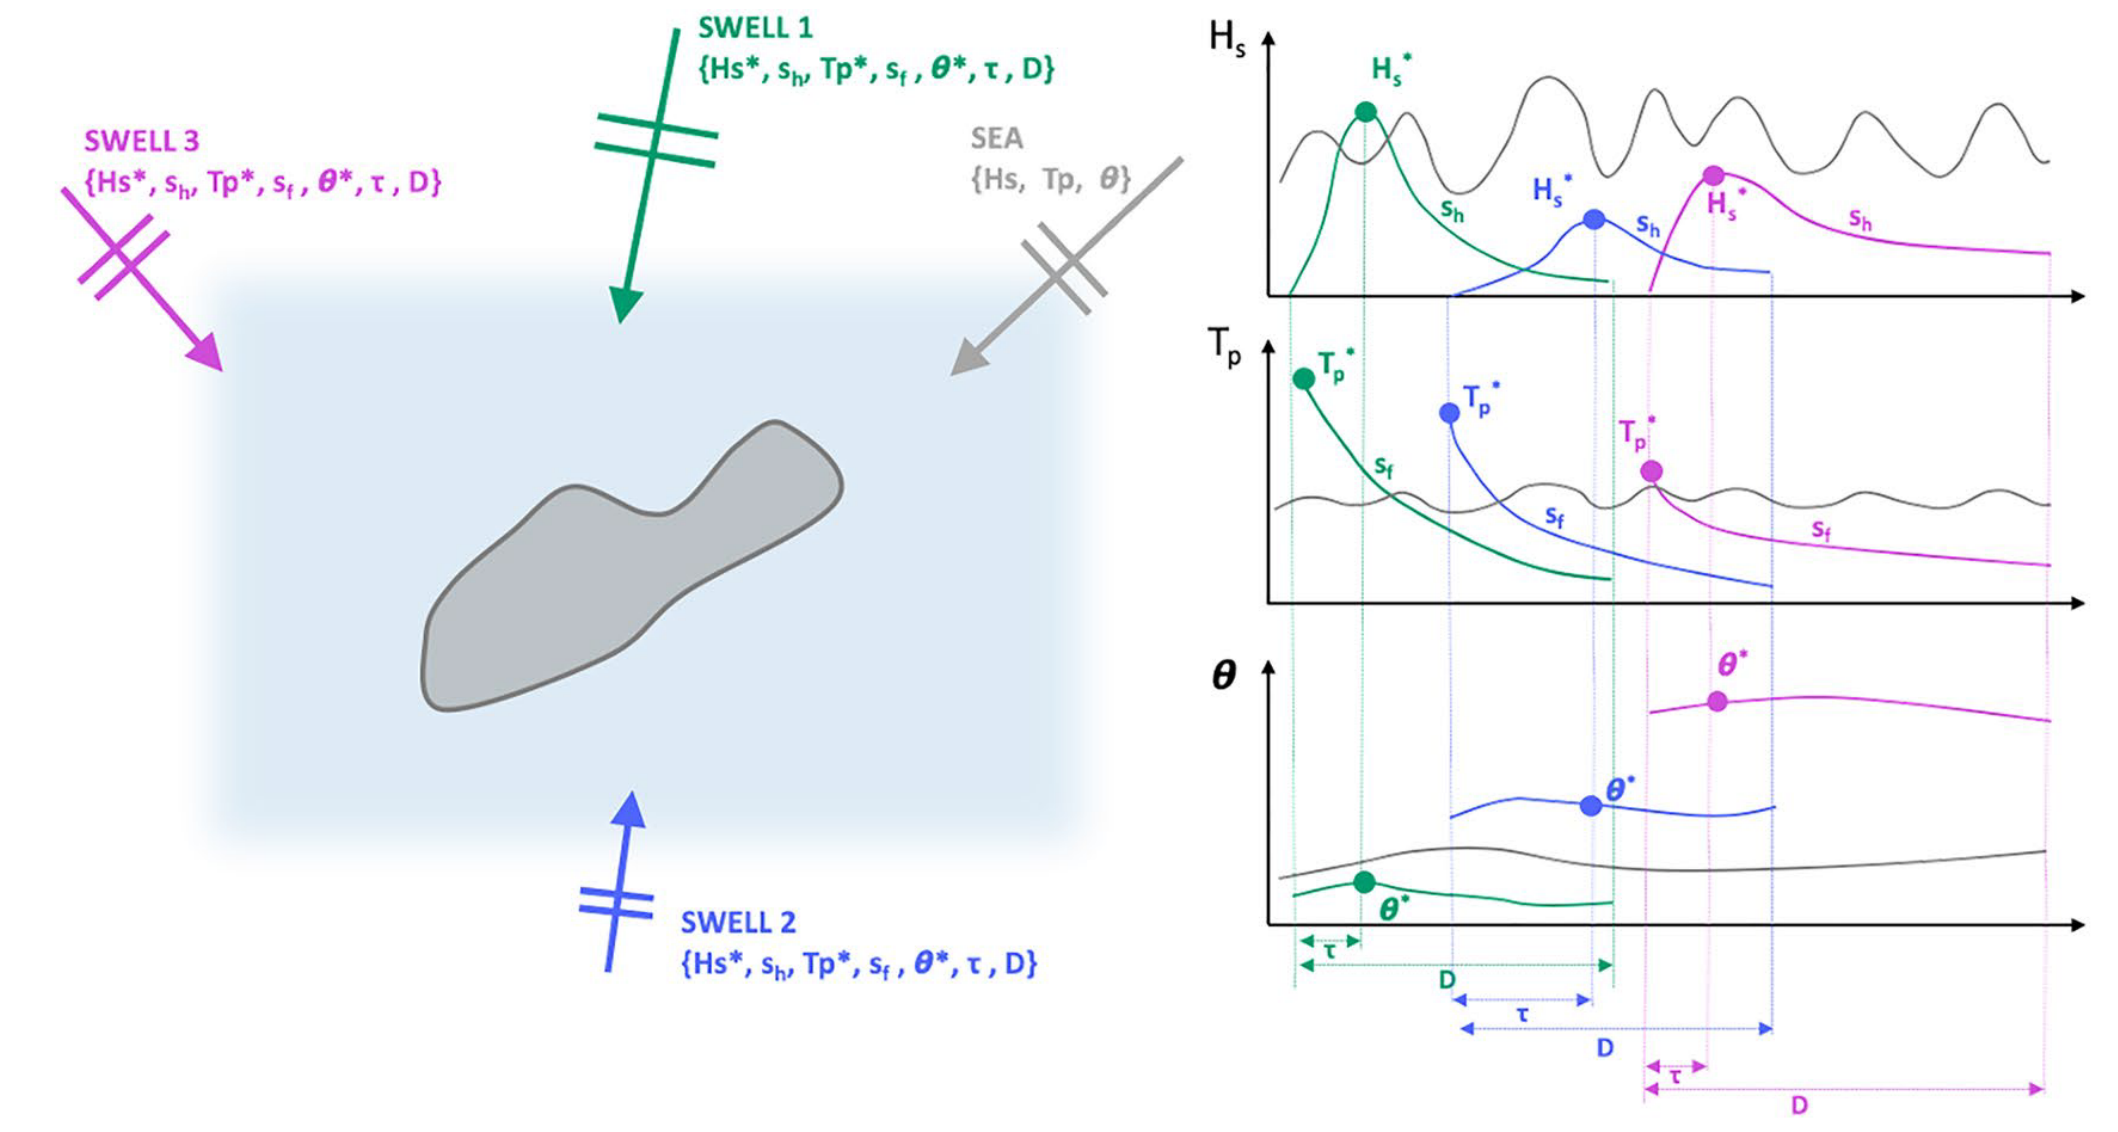
Aggregates spectral wave energy into a super-point and obtain wind waves and isolated swells following the methodology of Cagigal et al. (2021)
inputs required:
directional spectral from CAWCR at several points surrounding the study site
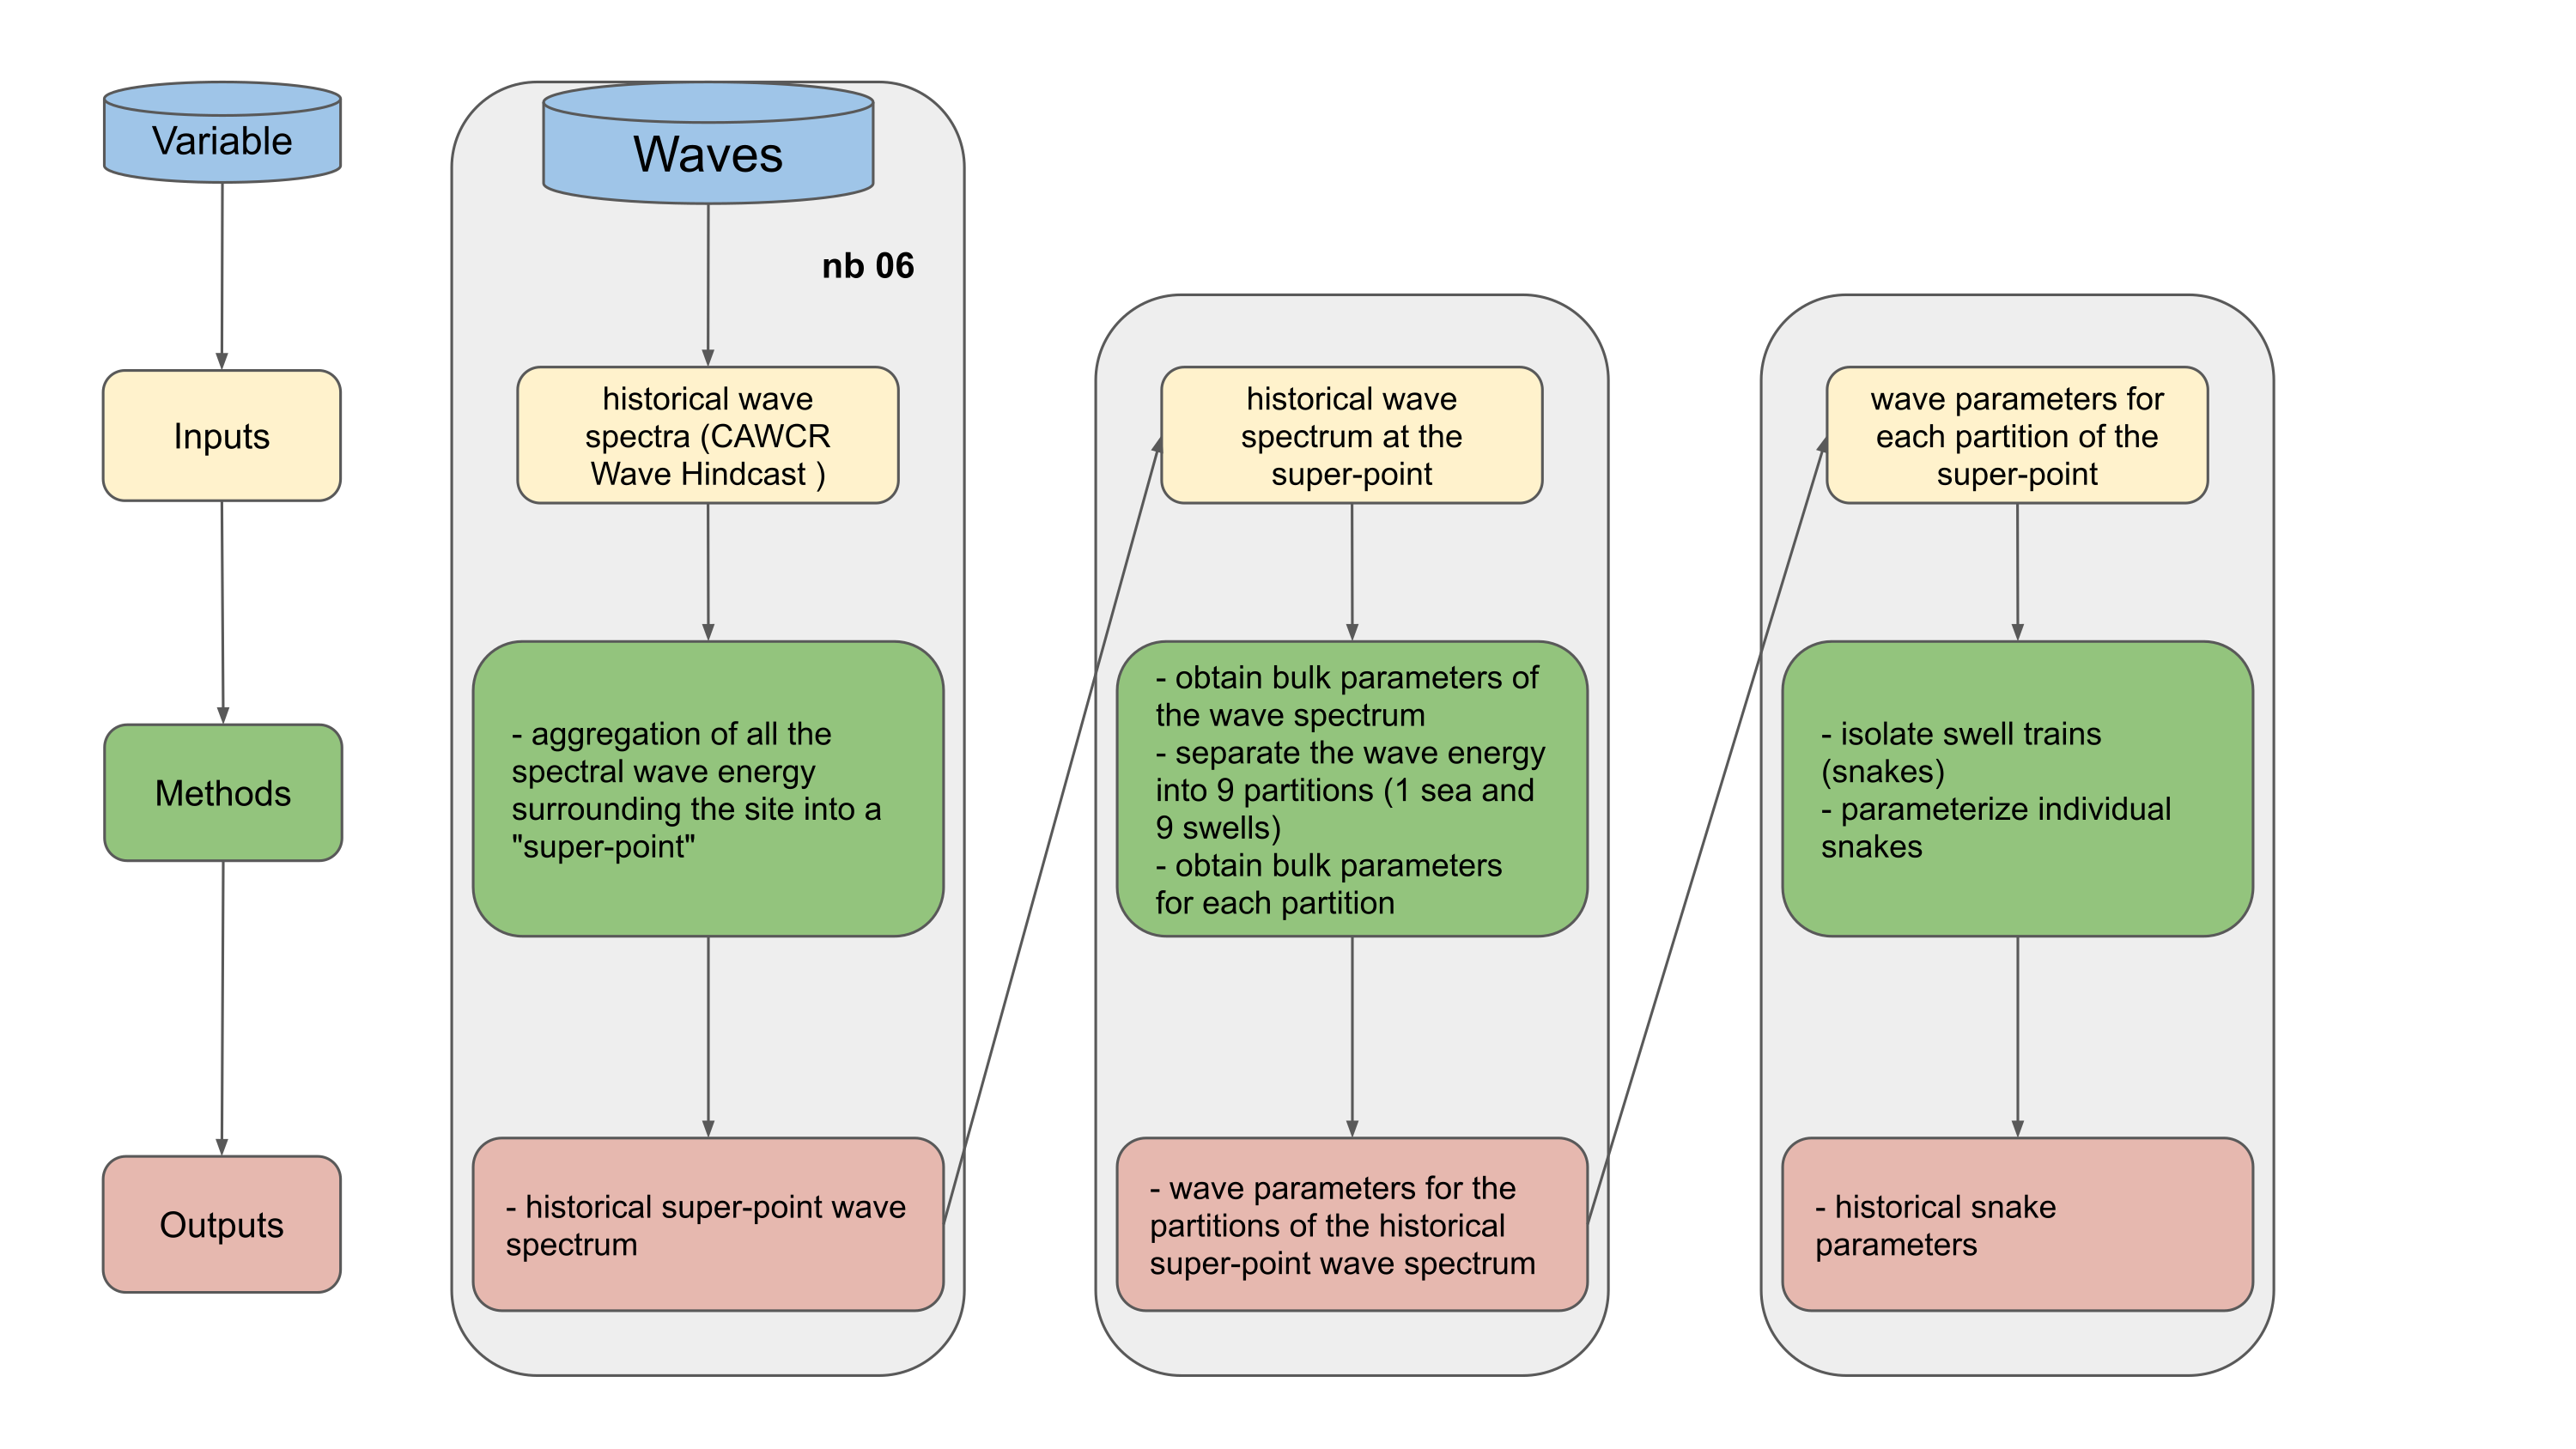
in this notebook:
Aggregation of spectral wave energy from a number of stations surrounding the study site: Obtain the super-point
Use wavespectra library to obtain the representative partitions and bulk parameters from the super-point (https://github.com/metocean/wavespectra)
isolate the different swell trains (snakes), each time step will be defined by a sea and a number of different swells
Workflow:
In order to account for all the possible energy and to avoid the shadowing effect due to land presence, the first step consists on defining a super-point (Cagigal et al.2021), which aggregates the energy from a number of points surrounding the study site.
This virtual super-point has been constructed using the directional spectra from the CAWCR (Centre for Australian Weather and Climate Research) hindcast (Durrant et al., 2014; Smith et al., 2020), which provides spectral data at 10° resolution for the global grid, and 0.5° for the Pacific Region, in which our study is located.
# common
import os
import os.path as op
import sys

# pip
import xarray as xr
import numpy as np
import pandas as pd
import pickle as pk
import matplotlib.pyplot as plt

# DEV: override installed teslakit
sys.path.insert(0, op.join(os.path.abspath(''), '..', '..', '..', '..'))

# teslakit modules
from bluemath.teslakit2.waves.superpoint_partitions import SuperPoint_Superposition, BulkParams_Partitions
from bluemath.teslakit2.plotting.superpoint_partitions import Plot_stations, Plot_stations_spectrum, Plot_superpoint_spectrum, Plot_superpoint_spectrum_season, Plot_bulk_parameters, Plot_partitions
from bluemath.teslakit2.waves.snakes import Normalize_inputs, Isolate_snakes, parameterize_Snakes
from bluemath.teslakit2.plotting.snakes import plot_snakes
Warning: ecCodes 2.21.0 or higher is recommended. You are running version 2.20.0
6.1. Files and paths#
# project path
p_data =  r'/media/administrador/HD2/SamoaTonga/data'
site = 'Samoa'
p_site = op.join(p_data, site)

# deliverable folder
p_deliv = op.join(p_site, 'd09_TESLA')

# output path
p_out = op.join(p_deliv,'WAVES')
p_out_snakes = op.join(p_deliv,'WAVES','Snakes')
if not os.path.isdir(p_out): os.makedirs(p_out)
if not os.path.isdir(p_out_snakes): os.makedirs(p_out_snakes)


# input data
spec_path = op.join(p_deliv,'resources','waves')

# output data
superpoint_file = op.join(p_out,'Super_point_superposition_')
partitions_file = op.join(p_out, 'partitions_stats_wcut_')
bulk_file = op.join(p_out, 'bulk_params_wcut_')
params_file = op.join(p_out,'Snakes_Parameters.nc')

# also stores spectrum partitions: "partitions_spectra_chunk_*_wcut_1e-11.nc"
6.2. Parameters#
# SUPERPOINT parameters
stations_id=[2193, 2195, 2187, 2178, 2170, 2168, 2166, 2175, 2183, 2191] #Stations to build super point
sectors=[(337.5,22.5),(22.5,60),(60,90),(90,120),(120,157.5),(157.5,202.5),(202.5,240),(240,270),
         (270,300),(300,337.5)] #Angle covered by each station

deg_sup=15 #Degrees of superposition
stations_pos=[9,0,1,8,2,7,3,6,5,1] #positions of the stations for plotting
st_wind=2195 #Station to take the wind from

lat_p=-13.76
lon_p=-172.07


# WAVESPECTRA PARAMETERS
wcut=0.00000000001 #Wind cut
msw=8 #Max number of swells
agef=1.7#Age Factor
model='csiro'

part0=True #None if we dont want a sea partition (that will change wind to 0)


# SNAKE PARAMETERS
coefs=[1,1,1,0,0] #Relative weight of each variables Hs, Tp, Dir, Dspr, Gamma
er=0.08 #Error for each variable (%)This is used to compute the maximum distance, not individually
MaxPerc_tp=0.25 #Percentage tp can decrease
MaxPerc_hs=0.2 #Percentage hs can change (increase and decrease)
min_hs=0.05 #Minimum Hs to consider a snake
n_hours_min=10 #Minimum number of consecutive hours to consider a snake
n_hours_max=12*24 #Maximum number of consecutive hours to consider a snake
max_jump=15
gamma_lim=50
6.3. Super Point definition#
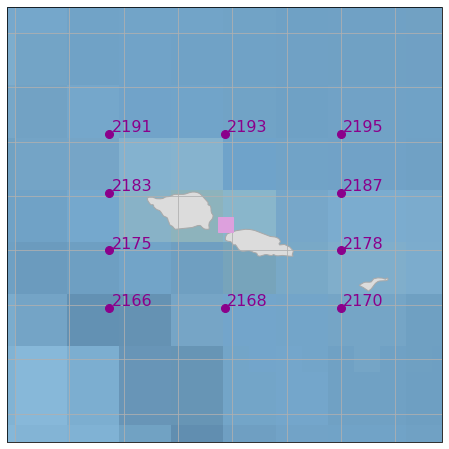
# plot Super Point stations

fig = Plot_stations(
    spec_path, stations_id,
    lon_p = lon_p, lat_p = lat_p,
    extra_area = 2, #Degrees surrounding the objective point
    figsize = [12, 8],
)
# Construct super point

sp = SuperPoint_Superposition(spec_path, stations_id, sectors, deg_sup, st_wind)
sp.to_netcdf(os.path.join(p_out,superpoint_file + str(deg_sup) +'.nc'))

#sp = xr.open_dataset(os.path.join(p_out, superpoint_file + str(deg_sup) +'.nc'))

print(sp)
<xarray.Dataset>
Dimensions:  (dir: 24, freq: 29, time: 366477)
Coordinates:
  * time     (time) datetime64[ns] 1979-01-01 1979-01-01T01:00:00 ... 2020-10-01
  * dir      (dir) float32 262.5 247.5 232.5 217.5 ... 322.5 307.5 292.5 277.5
  * freq     (freq) float32 0.035 0.0385 0.04235 ... 0.4171 0.4589 0.5047
Data variables:
    efth     (time, freq, dir) float64 ...
    Wspeed   (time) float32 ...
    Wdir     (time) float32 ...
    Depth    (time) float32 ...
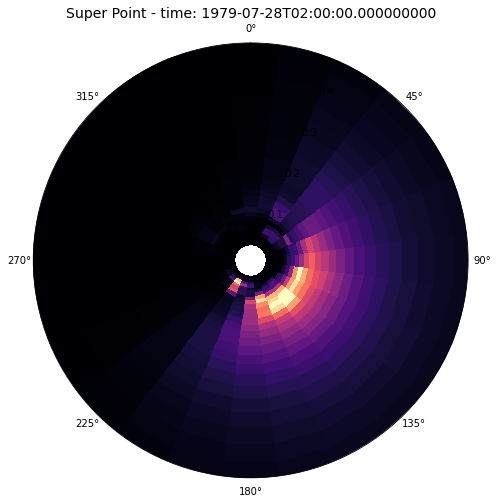
# Plot Super point spectrum for a given time

time_index = 5000 #Time step to plot

Plot_superpoint_spectrum(sp, time_index);
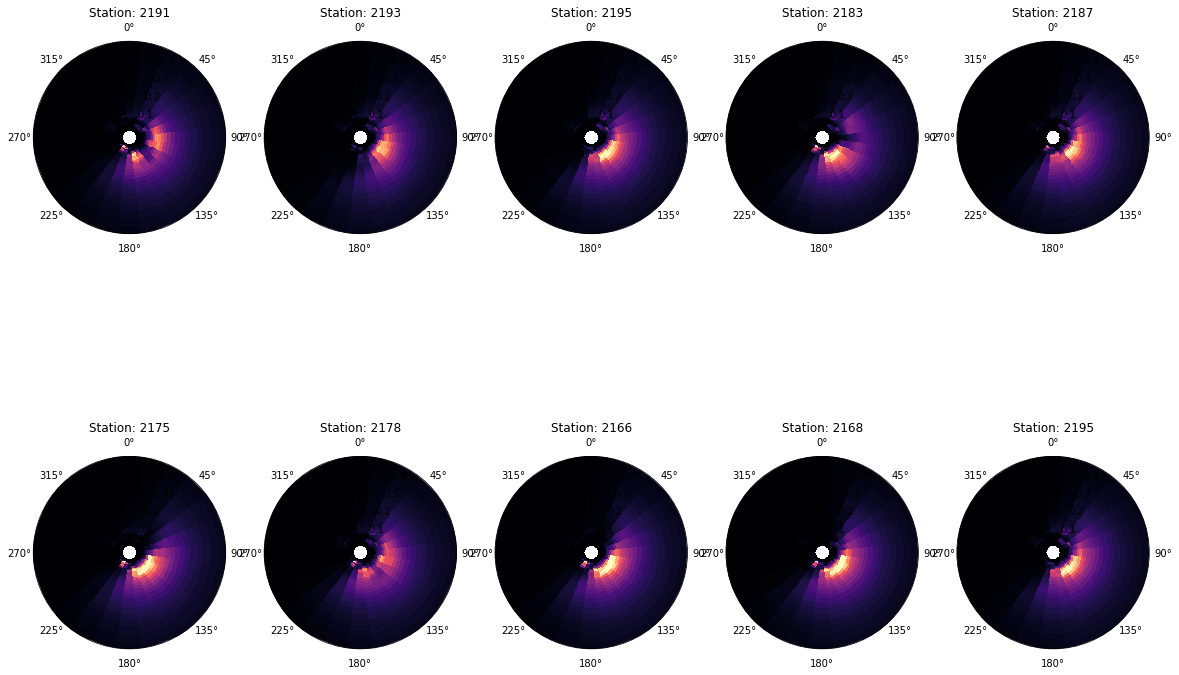
# Plot the spectrum at each of the different stations for the same time:

Plot_stations_spectrum(
    spec_path, stations_id, stations_pos,
    time_index,
    gs_rows = 2, gs_cols = 5,
    figsize = [20, 14],
);
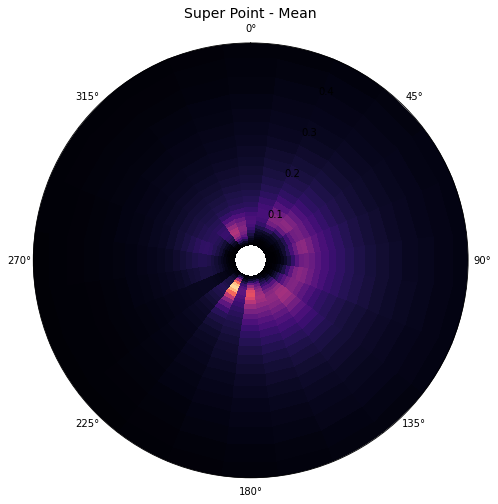
# Plot the mean super point spectra

Plot_superpoint_spectrum(sp, average=True);
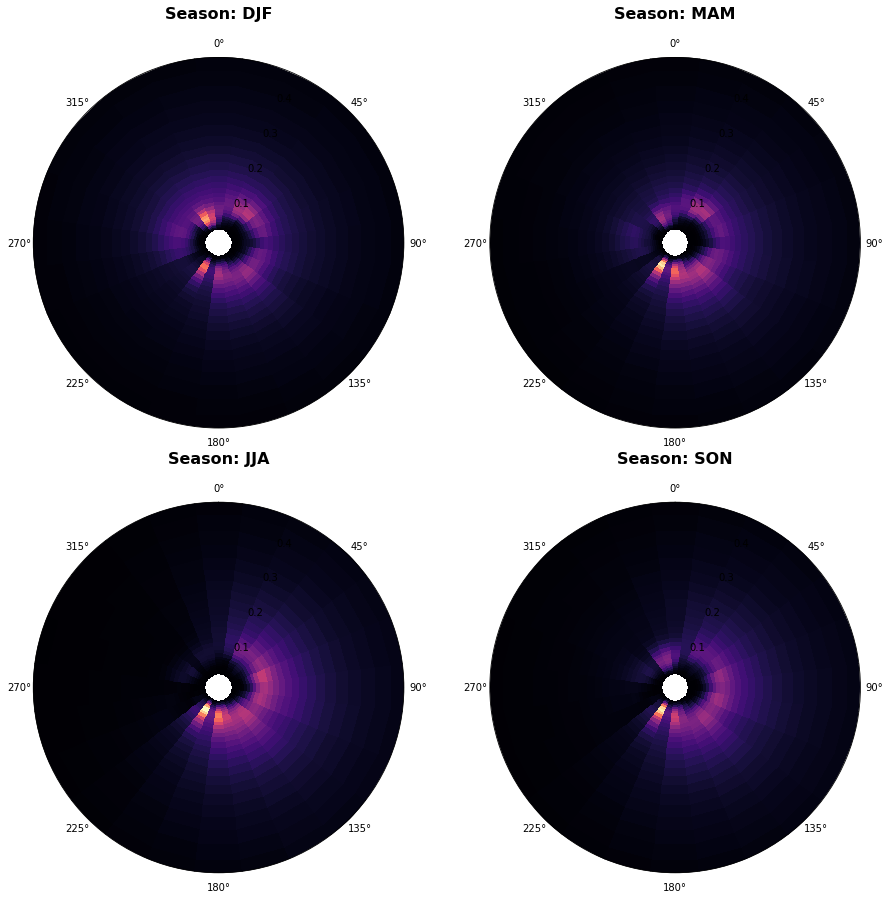
# plot mean spectrum by season

Plot_superpoint_spectrum_season(sp);
6.4. Obtain superpoint partitions and bulk parameters#
# Load superpoint spectrum
sp = xr.open_dataset(os.path.join(p_out, superpoint_file + str(deg_sup) +'.nc'))

#Remove wind so no sea partition is created
if not part0:
    sp.Wspeed.values=np.zeros(np.shape(sp.Wspeed.values))


# obtain superpoint partitons and bulk parameters
bulk_params, spec_part = BulkParams_Partitions(p_out, sp, chunks=3, wcut=wcut, msw=msw, agef=agef)

# store partitions and bulk parameters
bulk_params.to_netcdf(os.path.join(p_out, bulk_file + str(wcut) +'.nc'))
spec_part.to_netcdf(os.path.join(p_out, partitions_file + str(wcut) +'.nc'))


#bulk_params = xr.open_dataset(os.path.join(p_out, bulk_file + str(wcut) +'.nc'))
#spec_part = xr.open_dataset(os.path.join(p_out, partitions_file + str(wcut) +'.nc'))
#------------------------------
# plot Bulk parameters
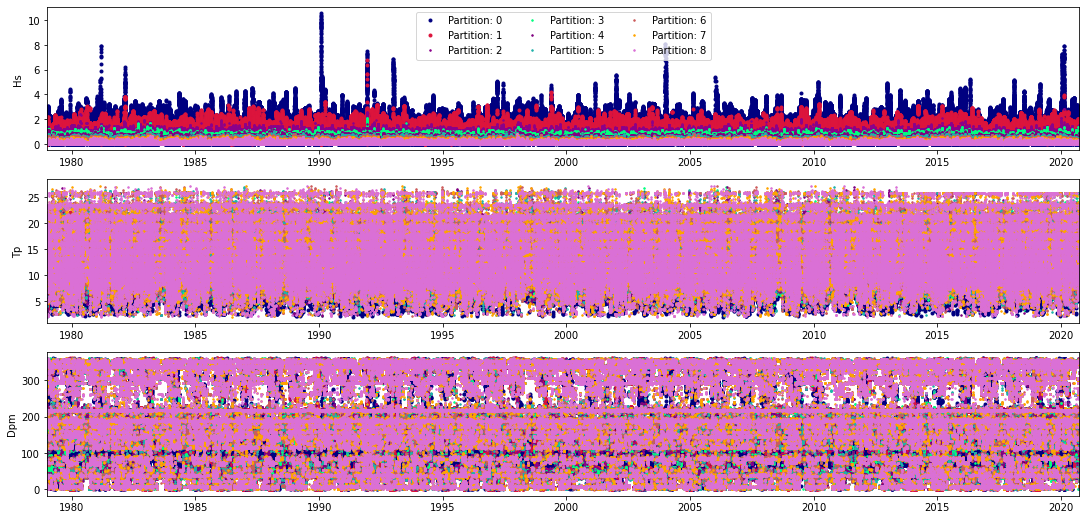
Plot_bulk_parameters(bulk_params);
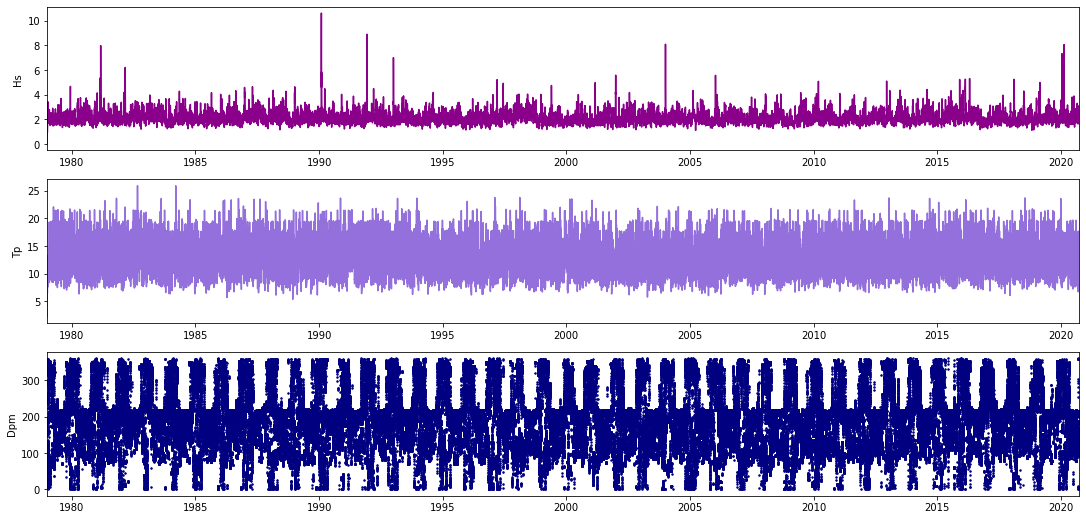
#------------------------------
# plot partitions

Plot_partitions(spec_part);
6.5. Isolate swell trains#
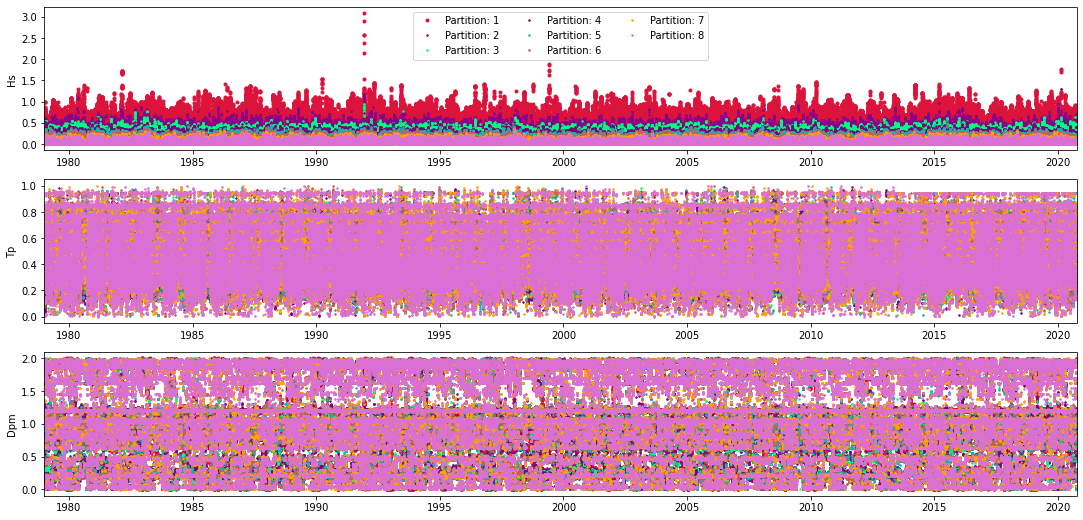
# keep the swell partitions and normalize the variables

part_ini = 1 #First partition to consider into the snakes isolation (0:SEA, 1:SWELL)
spec_part_swell = spec_part.sel(part=np.arange(part_ini,len(spec_part.part)))

spec_norm = Normalize_inputs(spec_part_swell, gamma_lim)

Plot_partitions(spec_norm);
# Isolate swells
snakes, namecont = Isolate_snakes(spec_norm, coefs=coefs,er=er,MaxPerc_t=0.03, MaxPerc_tp=MaxPerc_tp,
                                  MaxPerc_hs=MaxPerc_hs,max_jump=max_jump,n_hours_min=n_hours_min)

# save
pk.dump(snakes, open(os.path.join(p_out,'Snakes.pkl'),"wb"))


#snakes = pk.load(open(os.path.join(p_out,'Snakes.pkl'),'rb'))
#namecont=np.nanmax(snakes).astype('int')


print('Number of swell trains: ' + str(namecont))
Number of swell trains: 134843
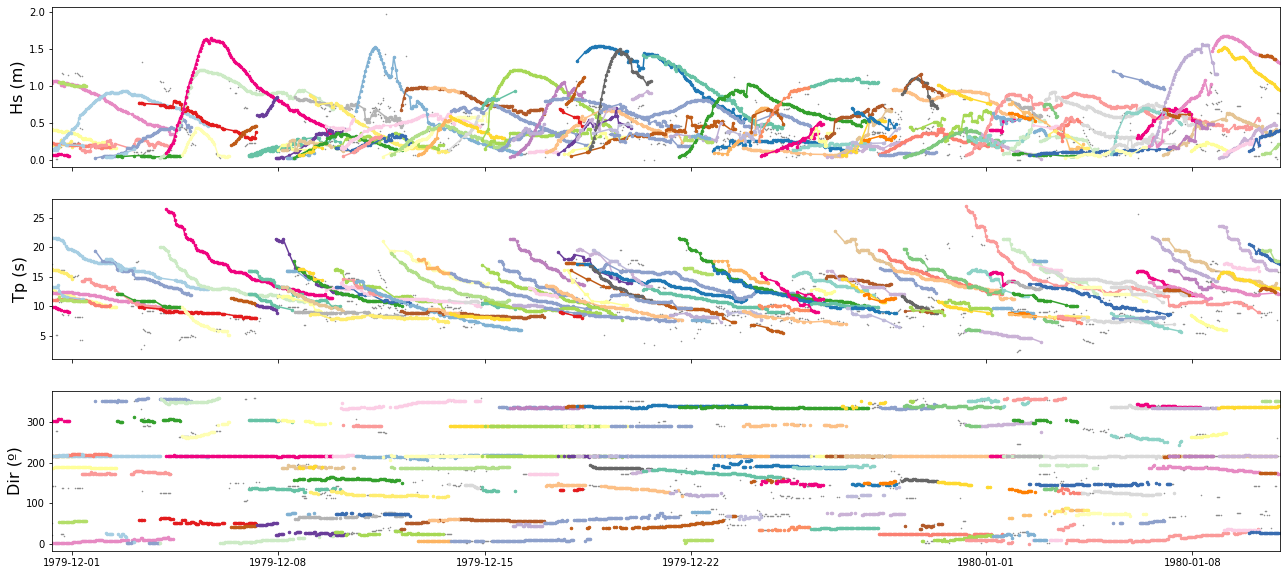
# plot snakes

ind_ini = 8000
ind_end = 9000

plot_snakes(spec_part_swell.isel(time=slice(ind_ini,ind_end)), snakes[:,ind_ini:ind_end], min_hs_plot=min_hs, min_plot=n_hours_min, plot_ini=False)
# get position of snakes that meet the requirements (min max duration and min hs)

posi=[]

for d in range(namecont-1):
    #d+1 Porque las snakes empiezan en 1 y no en 0
    A = np.where(snakes==d+1)[0][np.argsort(np.where(snakes==d+1)[1])]
    B = np.where(snakes==d+1)[1][np.argsort(np.where(snakes==d+1)[1])]
    ind_snake = np.where(snakes==d+1)[1]
    len_snake = len(np.arange(np.min(ind_snake),np.max(ind_snake)+1))

    if len_snake>n_hours_min and len_snake<n_hours_max and np.nanmax(spec_part_swell.hs.values[A, B])>min_hs:
        posi=np.append(posi,d+1)


# save
pk.dump(posi, open(os.path.join(p_out,'Snakes_posi.pkl'),"wb"))
# Parameterize Swells

#posi = pk.load(open(os.path.join(p_out,'Snakes_posi.pkl'),'rb'))

def func(x,a,b):
    return (a+b*x)

func_hs=func; func_tp=func; func_dir=func; func_dspr=func; func_gamma=func;


# Parameterize
snakes_parameters = parameterize_Snakes(p_out_snakes,spec_part_swell, snakes, posi, func_hs, func_tp, func_dir, func_dspr, func_gamma)

# save
snakes_parameters.to_netcdf(params_file)