Waves emulator
Contents
10. Waves emulator#
Obtain synthetic waves timeseries
inputs required:
Historical DWTs
Historical AWT
Synthetic timeseries of AWT
Historical spectrum and partitions
Historical wave parameters (seas & swells)
Synthetic wave parameters (seas & swells)
in this notebook:
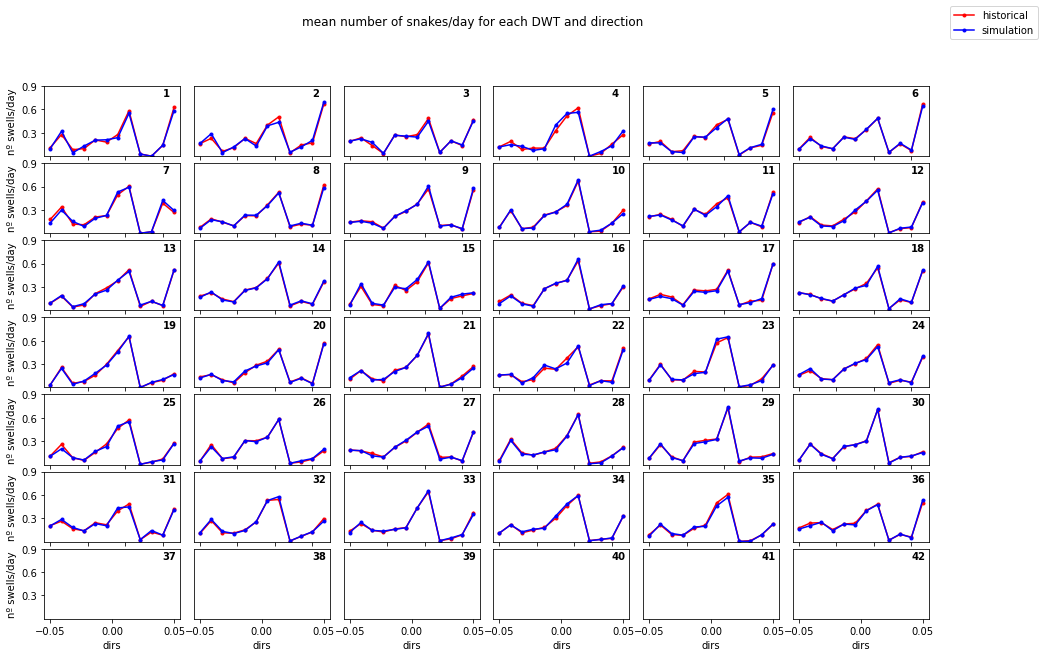
Obtain the historical number of swells for each DWT and direction
Generate synthetic time series of Sea conditions (daily)
Generate synthetic time series of Swell parameters (daily)
Reconstruct hourly time series of seas and swells
Reconstruct wave spectrum
Obtain bulk parameters
Validate the synthetic waves
Workflow:
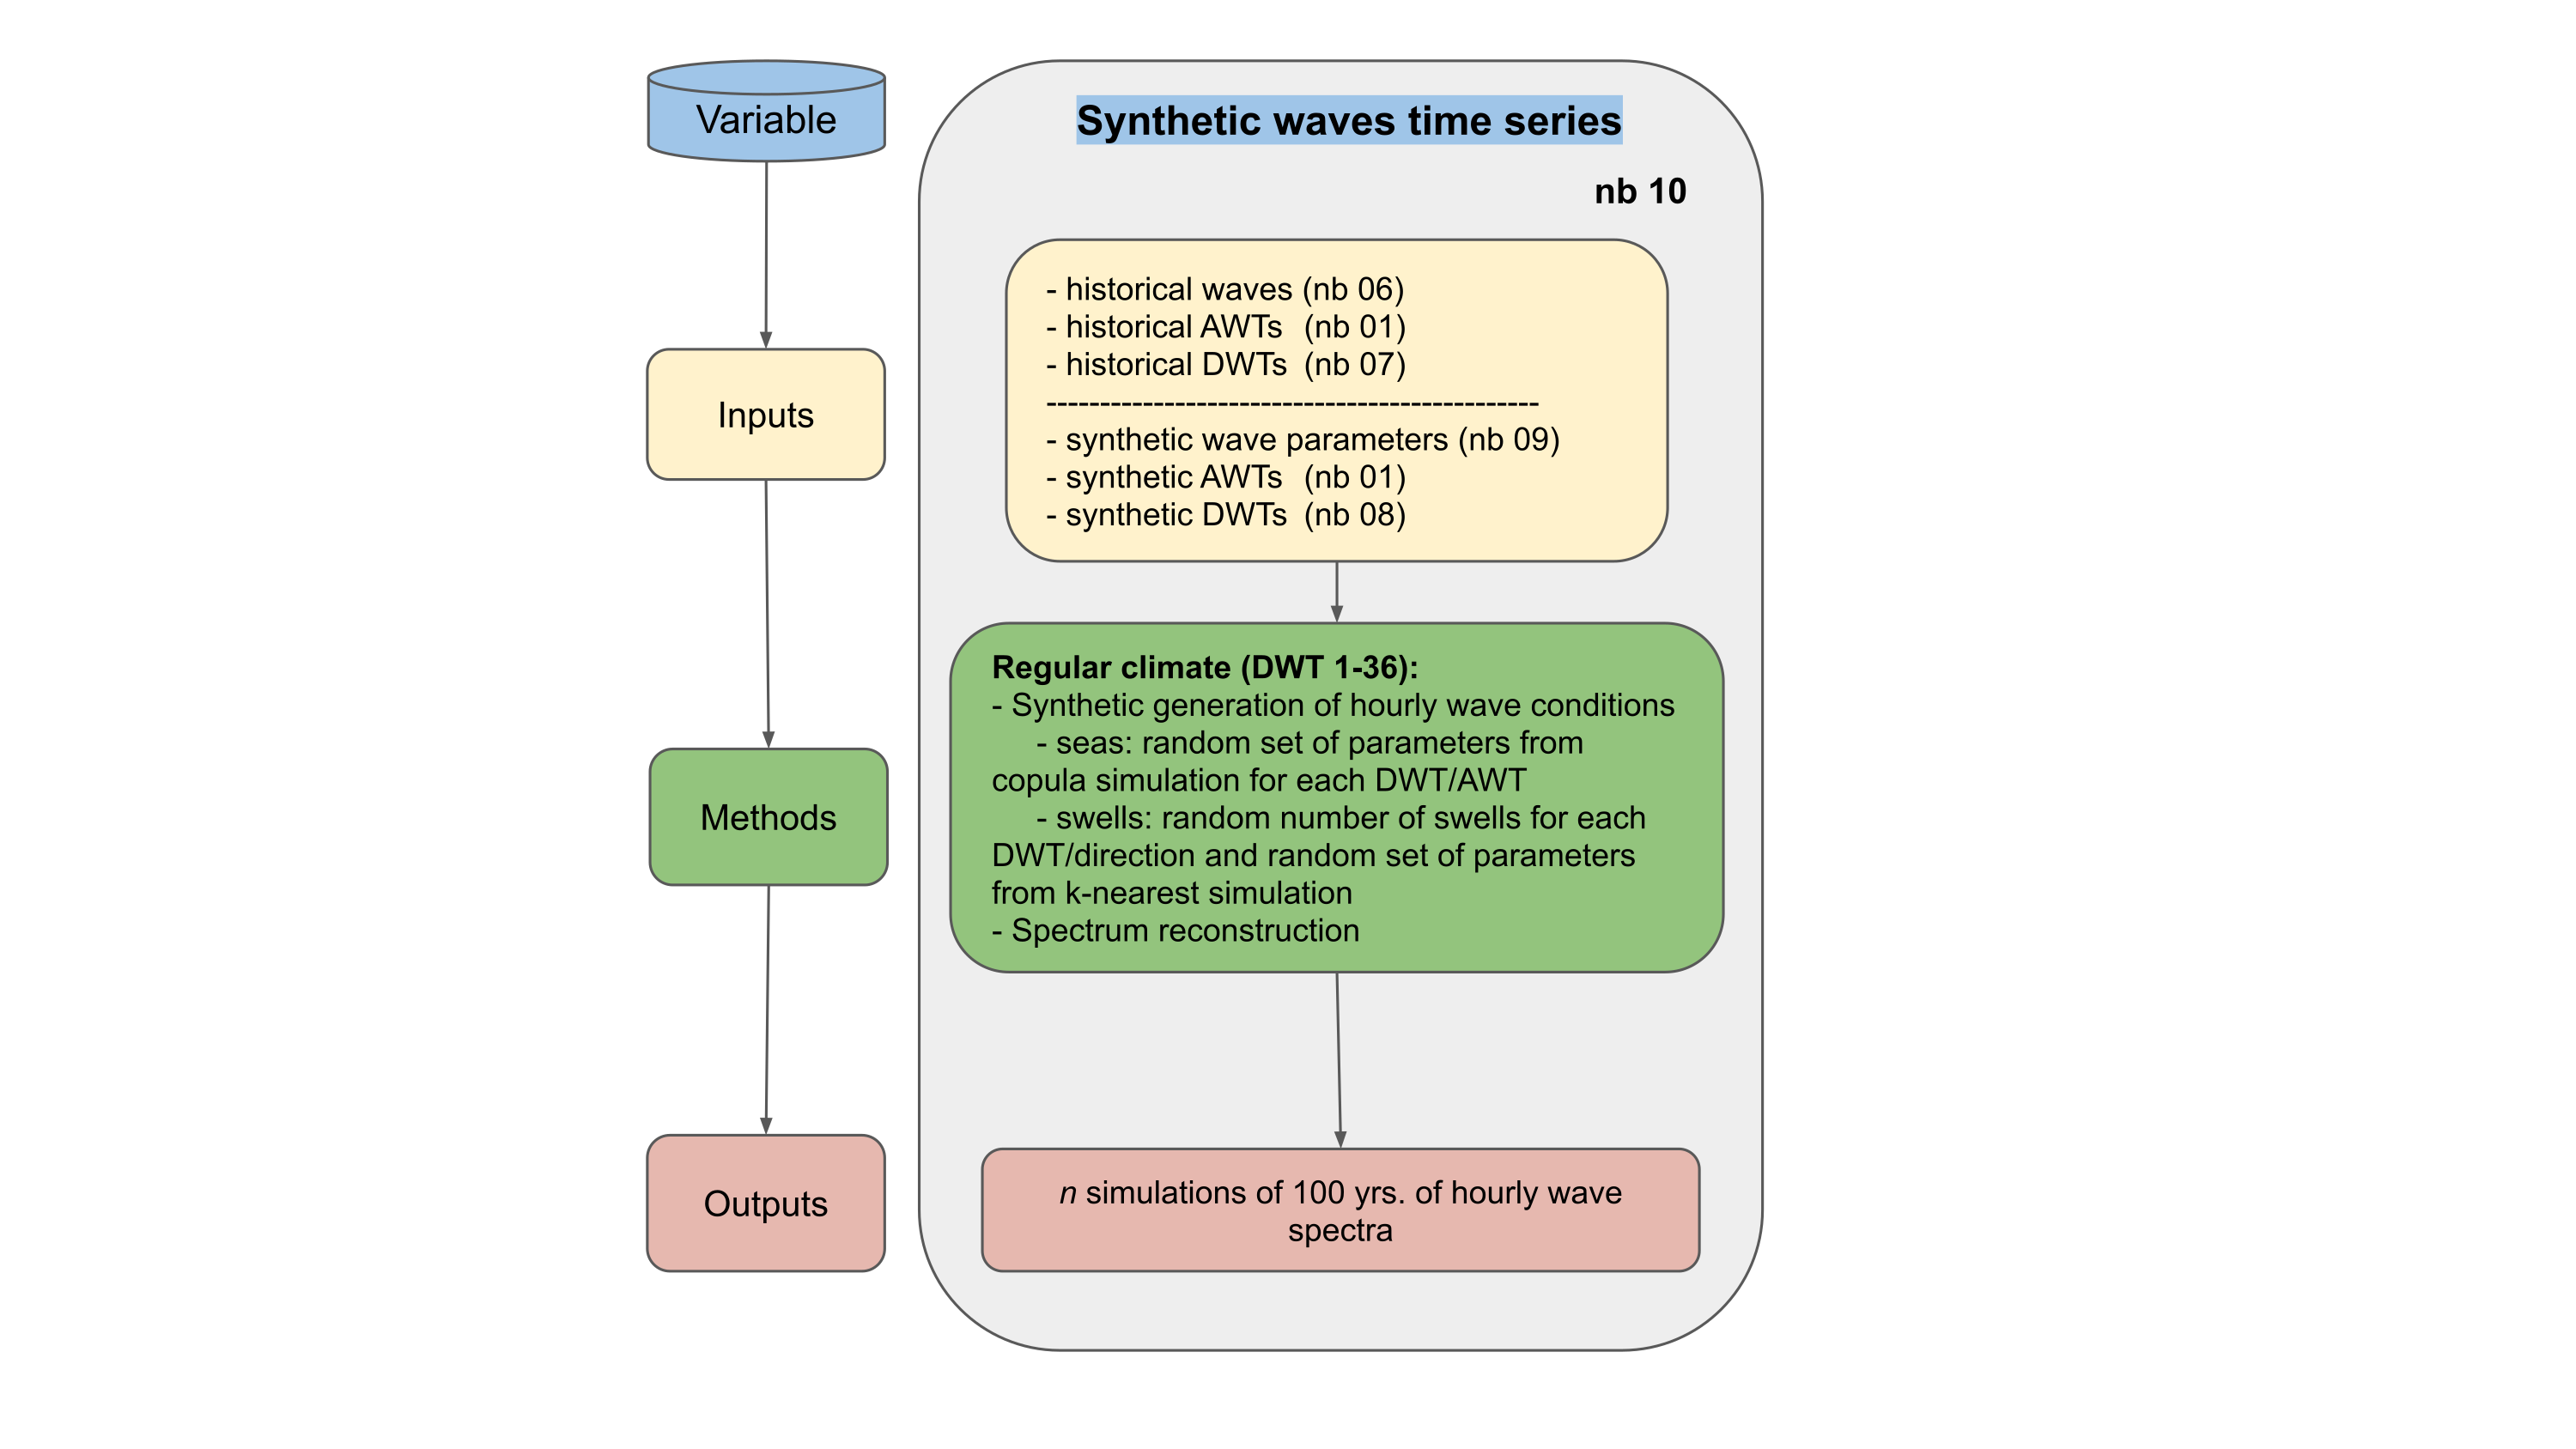
The synthetic generation of wave conditions on a regular climate (DWT1-36) is accomplished by selecting one of the copula simulated parameters for each DWT/AWT in the case of seas, and by randomly selecting the number of probable swells for each direction and DWT and the associated parameters from the k-nearest simulation
In the case on waves associated to a TC event (DWT36-42), the associated simulated waves from SHyTCWaves are incorporated in following notebooks.
#!/usr/bin/env python
# -*- coding: utf-8 -*-

# common
import os
import os.path as op

# pip
import numpy as np
import pandas as pd
import xarray as xr
from datetime import datetime
import matplotlib.pyplot as plt
import itertools

# DEV: override installed teslakit
import sys
sys.path.insert(0, op.join(os.path.abspath(''), '..', '..', '..'))

# teslakit
from bluemath.teslakit2.io.aux_nc import StoreBugXdset
from bluemath.teslakit2.util.time_operations import generate_hourly_time
from bluemath.teslakit2.waves.snakes import group_by_day_dir, reconstruct_snakes
from bluemath.teslakit2.waves_emulator import seas_emulator, swells_emulator, read_hourly_sim
from bluemath.teslakit2.waves.superpoint_partitions import spec_reconstr_snakes

from bluemath.teslakit2.plotting.snakes import plot_his_sim_NumSnakes, plot_sim_snakes
from bluemath.teslakit2.plotting.emulator import plot_his_sim_waves_hist
from bluemath.teslakit2.plotting.superpoint_partitions import Plot_superpoint_spectrum, axplot_spectrum
from bluemath.teslakit2.plotting.wts import axplot_WT_Probs
Warning: ecCodes 2.21.0 or higher is recommended. You are running version 2.20.0
10.1. Files and paths#
# project path
p_data =  r'/media/administrador/HD2/SamoaTonga/data'
site = 'Samoa'
p_site = op.join(p_data, site)

# deliverable folder
p_deliv = op.join(p_site, 'd09_TESLA')

# output path
p_out = op.join(p_deliv,'SIMULATION')
p_out_emul = op.join(p_deliv,'SIMULATION', 'climate_emulator')
p_out_waves = os.path.join(p_out_emul,'WAVES_noTCs')
p_out_spec = os.path.join(p_out_waves,'spec')

if not os.path.isdir(p_out): os.makedirs(p_out)
if not os.path.isdir(p_out_emul): os.makedirs(p_out_emul)
if not op.isdir(p_out_waves): os.makedirs(p_out_waves)
if not op.isdir(p_out_spec): os.makedirs(p_out_spec)


# input data
seas_hist_file = op.join(p_deliv,'WAVES','Sea_partition_dwt.nc')
snakes_hist_file = op.join(p_deliv,'WAVES','Snakes_Parameters_dwt.nc')
awt_his_file = op.join(p_deliv, 'SST', 'SST_KMA.nc') # for plotting

awt_sim_file = op.join(p_deliv,'SST','SST_AWT_sim.nc')
dwt_sim_file = op.join(p_deliv,'ESTELA','DWT_sim.nc')
snakes_sim_file = op.join(p_deliv,'WAVES' ,'Snakes_Parameters_copula_sim.nc') # copula sim
seas_sim_file = op.join(p_deliv,'WAVES', 'Sea_Parameters_copula_sim.nc') # copula sim

part_spec_file = op.join(p_deliv,'WAVES', 'partitions_spectra_chunk_1_wcut_1e-11.nc') # for spectrum reconstruction
part_stats_file = op.join(p_deliv,'WAVES', 'partitions_stats_wcut_1e-11.nc') # for spectrum reconstruction
superpoint_file = op.join(p_deliv,'WAVES', 'Super_point_superposition_15.nc') # for plotting


# output data
n_swells_file = op.join(p_out,'n_swells_fit.nc')  # number of swells/day for each direction
n_swells_file_sim = op.join(p_out,'n_swells_sim.nc')  # number of swells/day for each direction

mean_spec_file_sim = op.join(p_out_waves,'spec_mean_sim.nc')
10.2. Parameters#
# --------------------------------------
# load data and set parameters
DWTs_sim = xr.open_dataset(dwt_sim_file)
AWTs_sim = xr.open_dataset(awt_sim_file)

seas = xr.open_dataset(seas_hist_file)
snakes = xr.open_dataset(snakes_hist_file)

seas_copula_sim = xr.open_dataset(seas_sim_file)
snakes_copula_sim = xr.open_dataset(snakes_sim_file)

part_spec = xr.open_dataset(part_spec_file)
part_stats = xr.open_dataset(part_stats_file)

# number of DWTs
n_clusters = 36
10.3. Number of swells for each direction and for each DWT#
# Group snakes by day and by direction
n_swells = group_by_day_dir(snakes, n_clusters=n_clusters, amp_dir=30)

# save
n_swells.to_netcdf(n_swells_file)

#n_swells = xr.open_dataset(n_swells_file)
10.4. Climate Emulator - WAVES Simulation#
# historical. max number of snakes for one day
max_num_snakes = np.sum(n_swells.n_swells.values,axis=1)
max_num_snakes = int(np.max(max_num_snakes))
# Add AWT (needed for simulating seas)

# AWT to daily scale
AWTs_sim = AWTs_sim.resample(time='1D').pad()
AWTs_sim = AWTs_sim.sel(time=slice('2020-01-01','2100-01-01'))

DWTs_sim['evbmus_sims_awt'] = (('time', 'n_sim'),AWTs_sim.evbmus_sims.values)
import time

# --------------------------------------
#  Climate Emulator. WAVES simulation NO TCs


# each DWT series will generate a different set of waves

for n in DWTs_sim.n_sim:
    print('- Sim: {0} -'.format(int(n)+1))

    start = time.time()

    # Select simulation of DWTs
    DWTs_sim_n = DWTs_sim.isel(n_sim=n)


    #---------------------------
    # emulate seas
    #---------------------------
    print('Simulating Seas')
    sea_params_sim = seas_emulator(DWTs_sim_n, seas_copula_sim)

    # save
    sea_params_sim.to_netcdf(op.join(p_out_waves,'sea_params_{0:08d}.nc'.format(int(n))))

    # to hourly
    sea_params_sim = sea_params_sim.resample(time='1H').pad()


    #---------------------------
    # emulate swell parameters
    #---------------------------
    print('Simulating Swells')
    snake_params_sim = swells_emulator(n, DWTs_sim_n, n_swells, snakes_copula_sim, max_num_snakes, p_out_waves)

    # save
    StoreBugXdset(snake_params_sim, op.join(p_out_waves, 'snakes_params_{0:08d}.nc'.format(int(n)) ))


    #---------------------------
    # reconstruct swells
    years = snake_params_sim.time.dt.year.values
    for yy in np.arange(years[0],years[-1]):

        # data for one year
        y_ini = str(yy) + '-01-01'
        y_end = str(yy+1) + '-01-01'
        snake_params_sim_y = snake_params_sim.sel(time=slice(y_ini,y_end))

        # reconstruct snakes (snakes parameters to hourly snakes)
        time_h, hs_swell, tp_swell, dir_swell = reconstruct_snakes(max_num_snakes, snake_params_sim_y, 'sim')


        #---------------------------
        # reconstruct spectrum
        spectro, bulk = spec_reconstr_snakes(part_spec, part_stats, time_h, hs_swell, tp_swell, dir_swell, sea_params_sim, seaswell='both')


        # Join years of agregated snakes and spectrum
        if yy == years[0]:
            bulk_params = bulk.copy(deep=True)

        else:
            bulk_params = xr.concat([bulk_params, bulk], dim='time')

        # save spectrum for each year
        StoreBugXdset(spectro, op.join(p_out_spec, 'spectrum_hourly_{0:08d}_{1}.nc'.format(int(n),yy)))

    # save each sim
    print('sim completed')
    StoreBugXdset(bulk_params, op.join(p_out_waves, 'bulk_params_hourly_{0:08d}.nc'.format(int(n))))


    end = time.time()
    print((end - start)/3600)
    print()
10.5. Climate Emulator Simulation Validation#
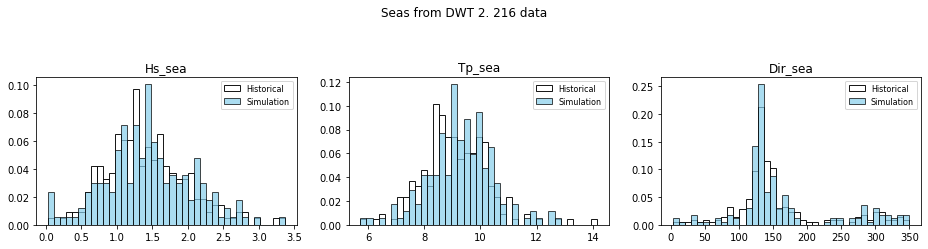
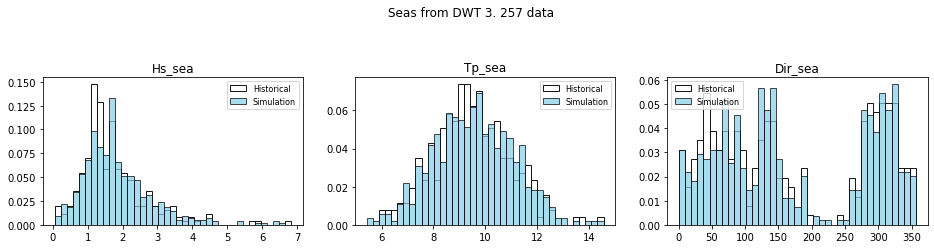
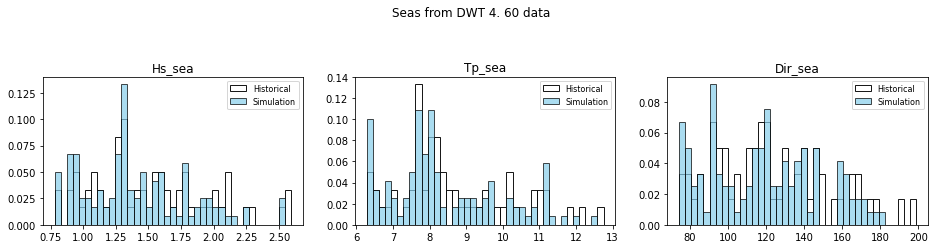
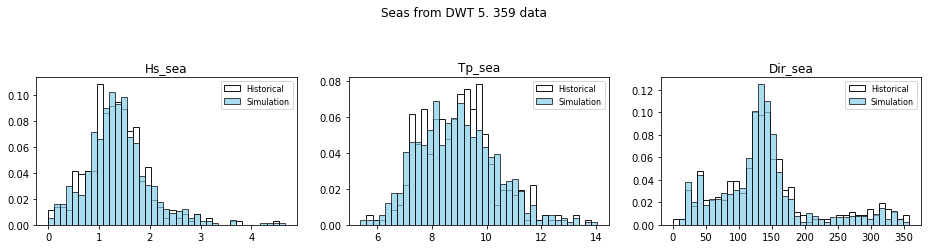
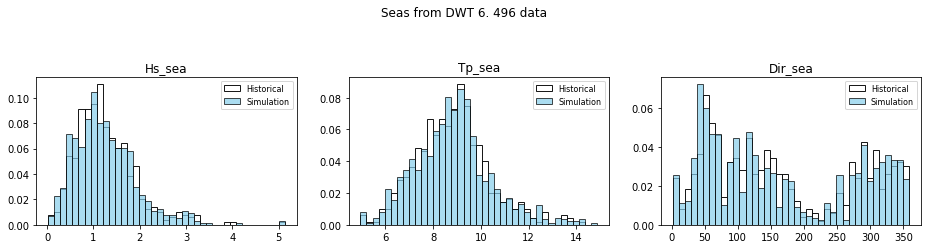
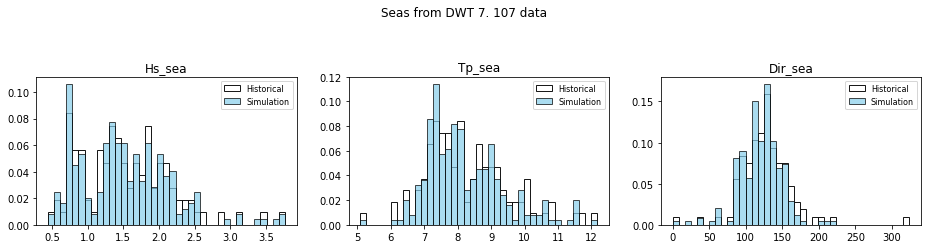
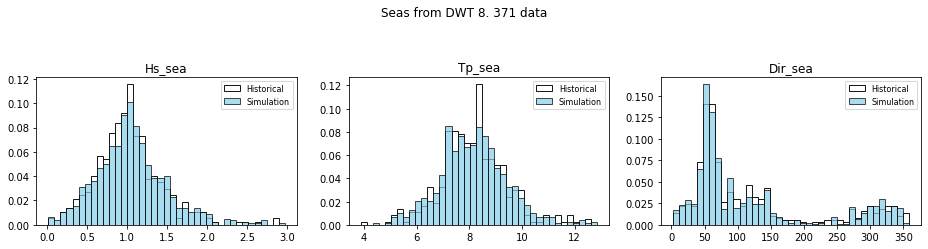
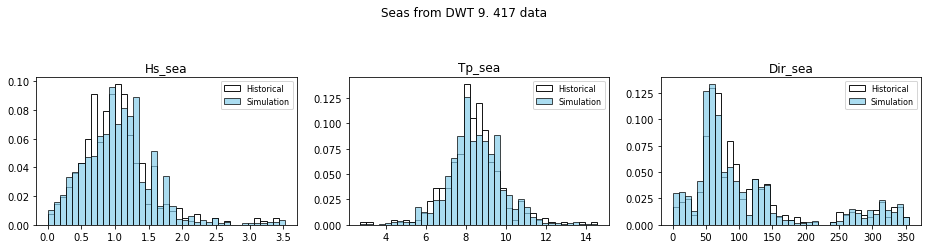
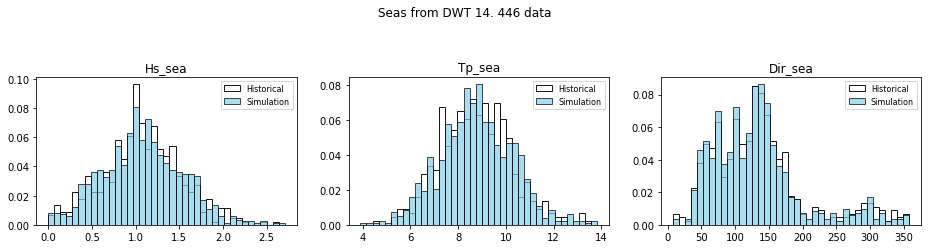
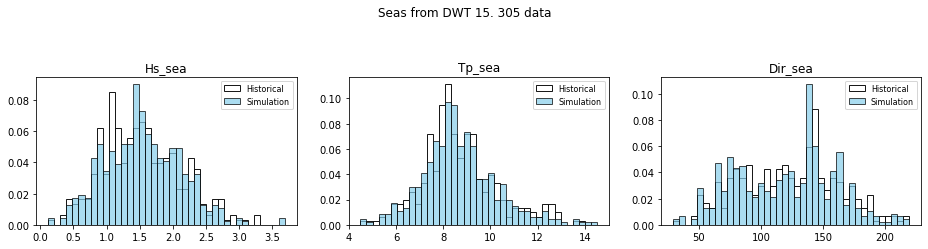
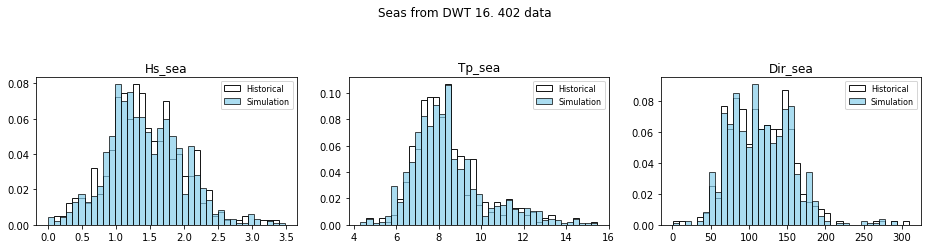
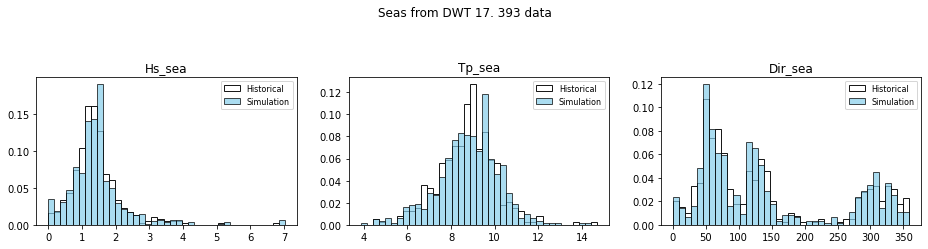
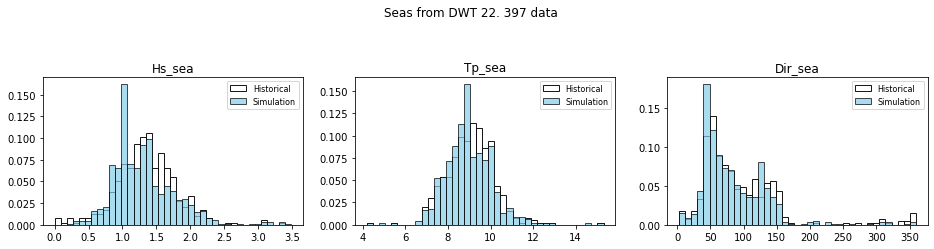
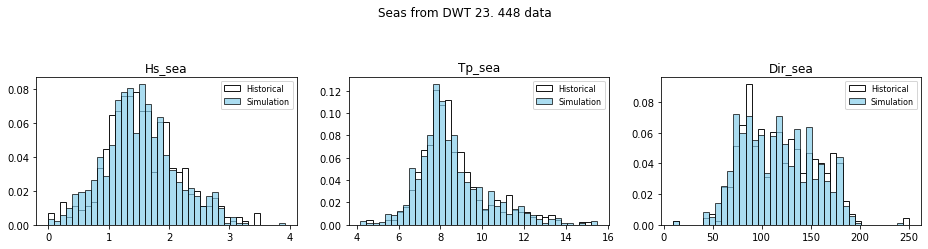
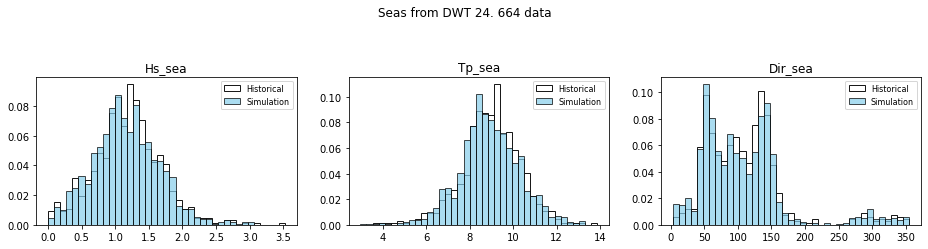
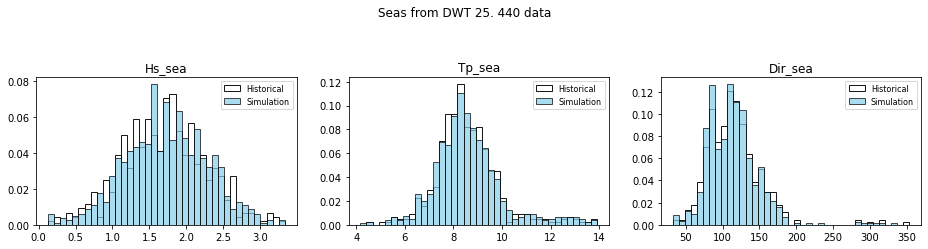
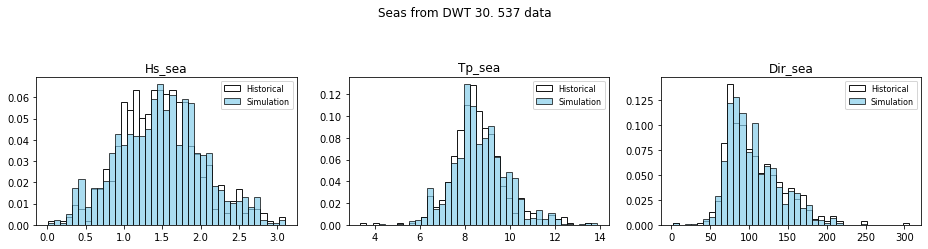
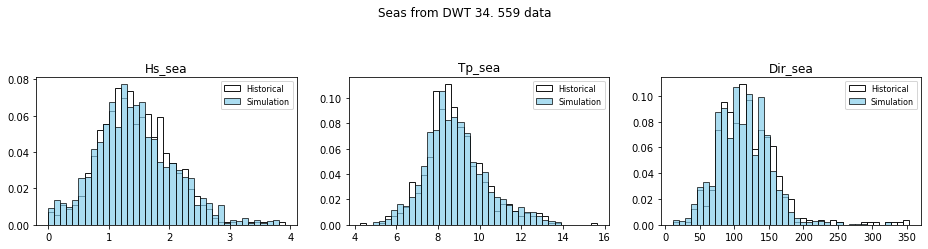
10.5.1. Validate emulator: Seas (daily values)#
# --------------------------------------
# Select Simulation to plot

n_sim = 39
sea_params_sim = xr.open_dataset(op.join(p_out_waves, 'sea_params_{0:08d}.nc'.format(int(n_sim))))
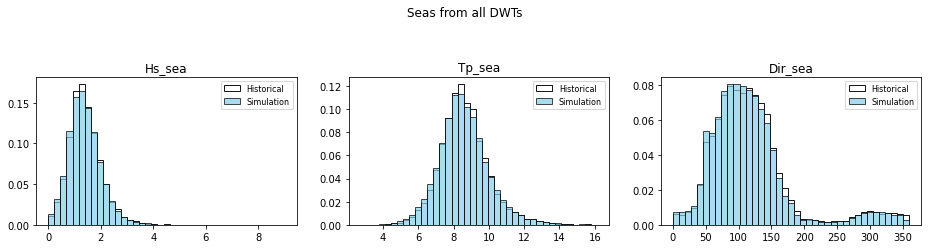
# Compare historical and simulated seas (all DWTs)
seas_his = seas.copy(deep=True)
seas_his = seas_his.rename({'hs':'Hs_sea', 'tp':'Tp_sea', 'dpm':'Dir_sea'})

sea_sim = sea_params_sim.copy(deep=True)
sea_sim = sea_sim.drop({'evbmus_sims', 'evbmus_sims_awt'})


plot_his_sim_waves_hist(seas_his, sea_sim, title='Seas from all DWTs')
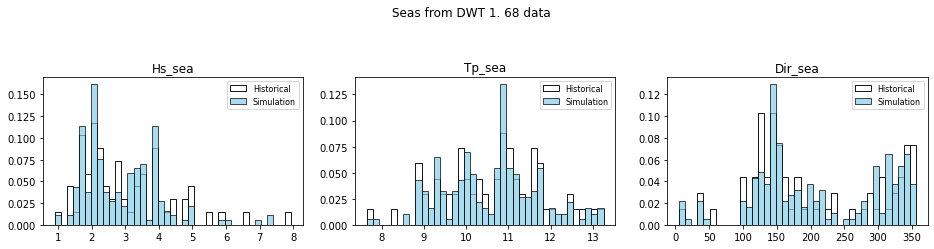
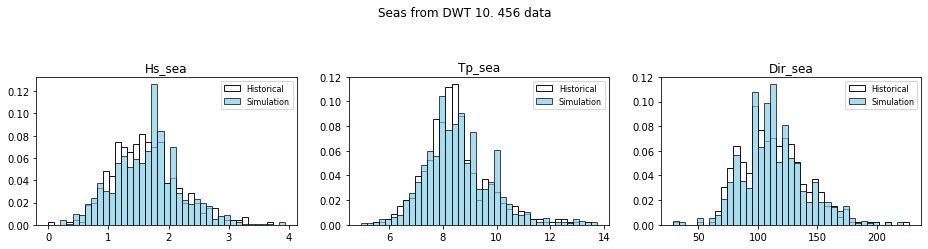
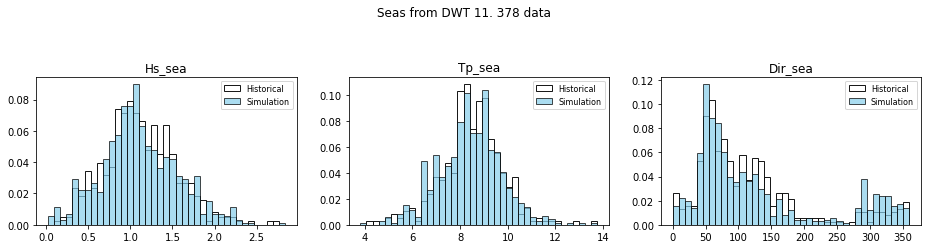
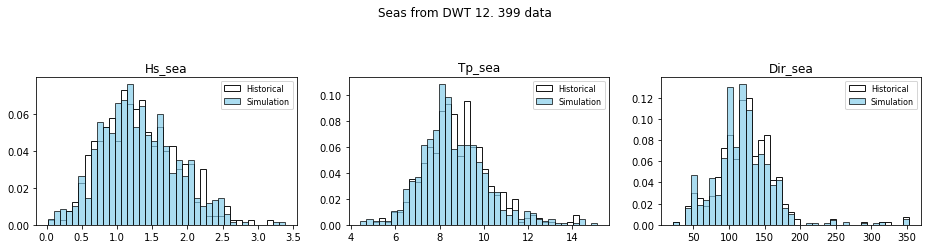
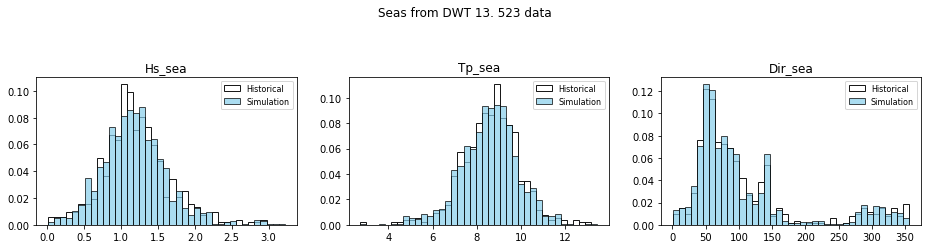
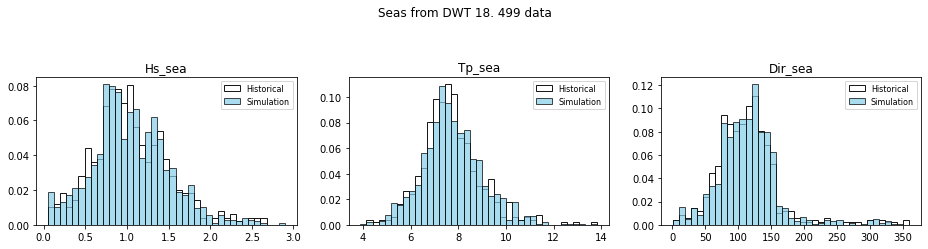
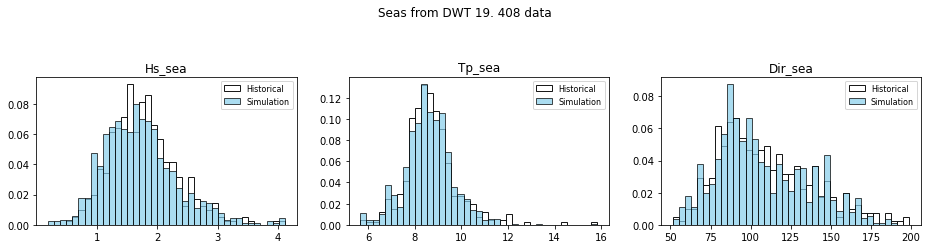
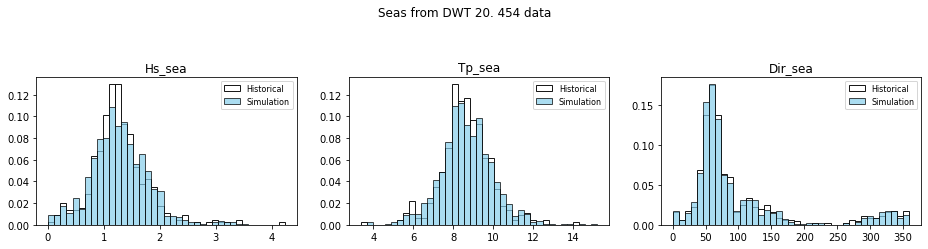
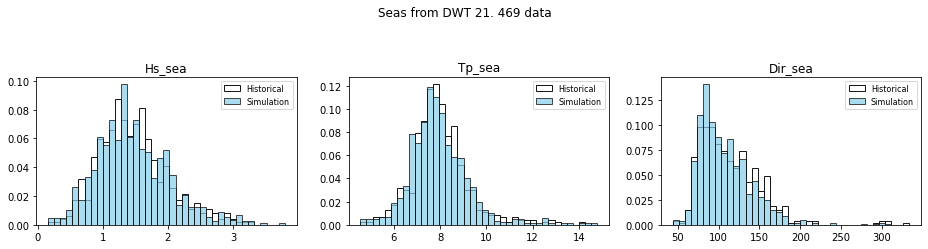
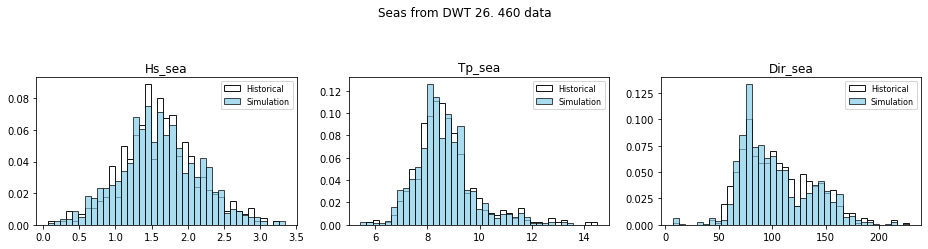
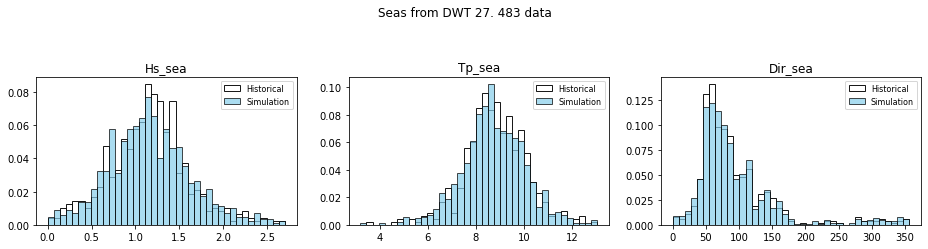
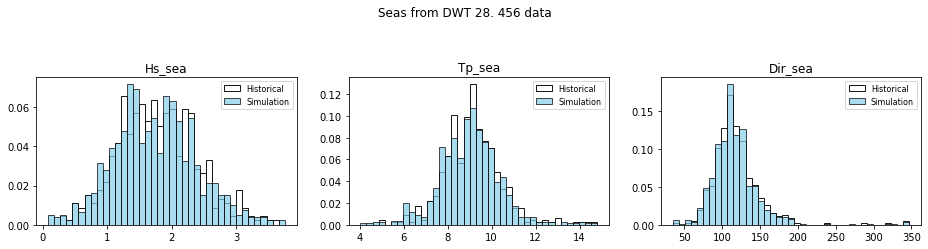
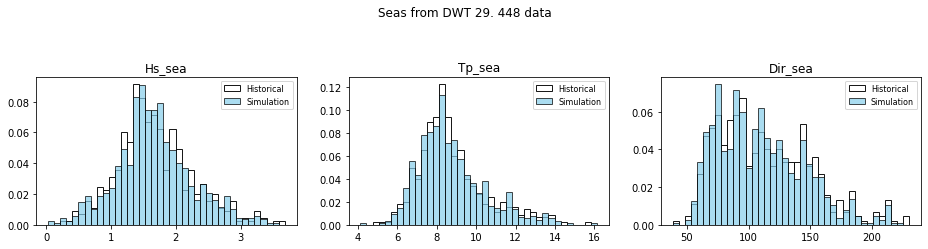
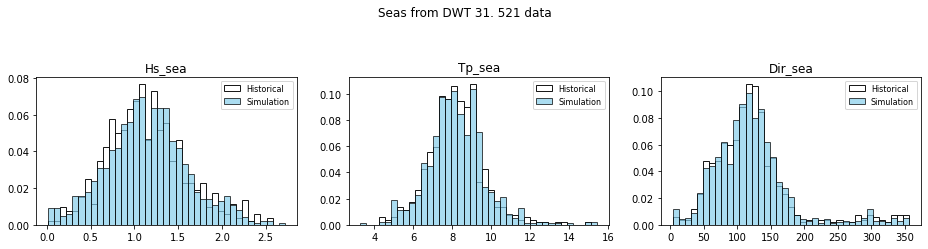
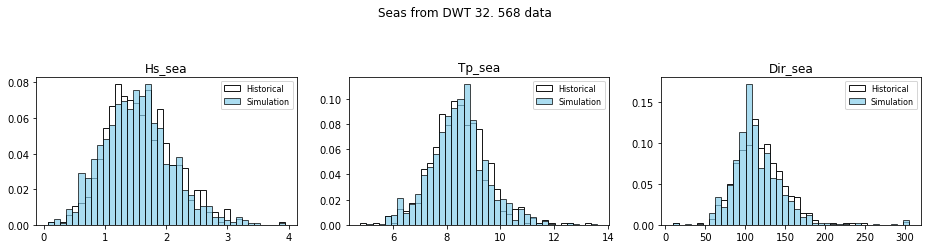
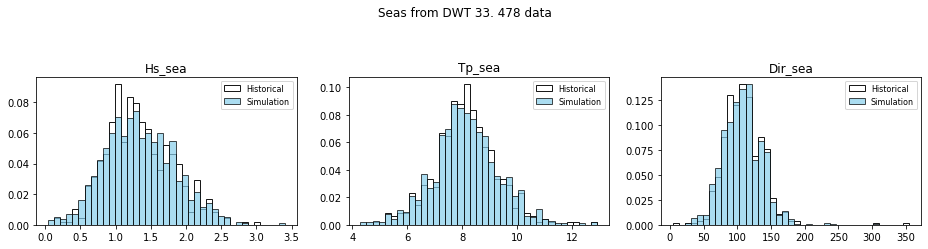
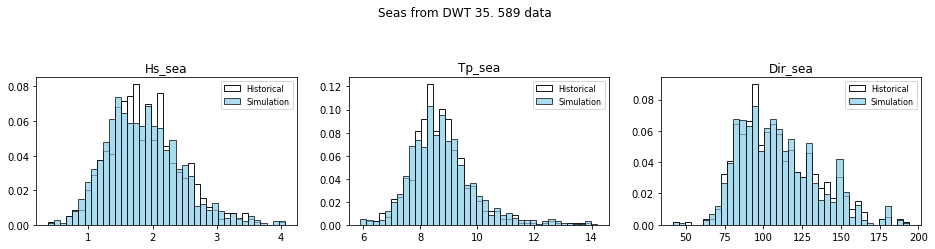
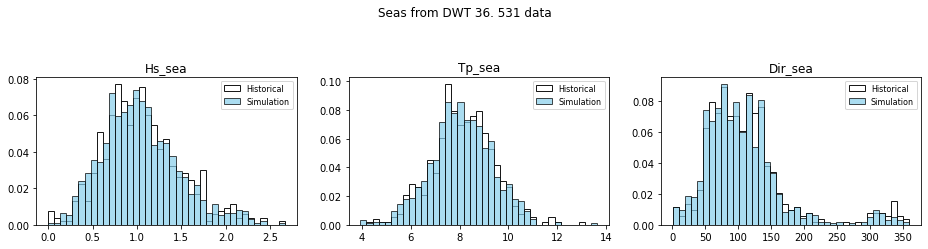
# Compare historical and simulated seas for each DWTs

seas_his = seas.copy(deep=True)
seas_his = seas_his.rename({'hs':'Hs_sea', 'tp':'Tp_sea', 'dpm':'Dir_sea'})

seas_sim = sea_params_sim.copy(deep=True)

for wt in range(n_clusters):

    seas_his_wt = seas_his.where(seas_his.bmus==wt, drop=True)
    seas_sim_wt = seas_sim.where(seas_sim.evbmus_sims==wt+1, drop=True)

    seas_sim_wt = seas_sim_wt.drop({'evbmus_sims','evbmus_sims_awt'})

    plot_his_sim_waves_hist(seas_his_wt, seas_sim_wt, title='Seas from DWT ' +  str(wt+1) + '. ' + str(len(seas_his_wt.time)) + ' data')
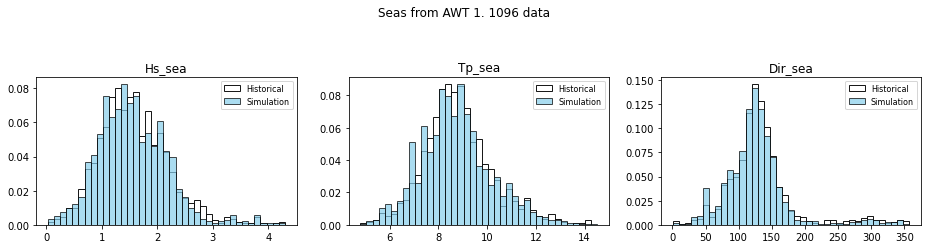
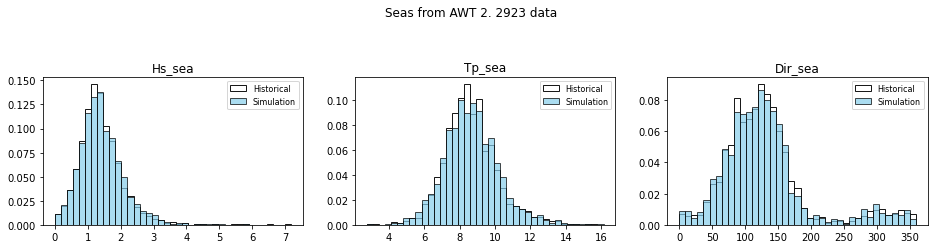
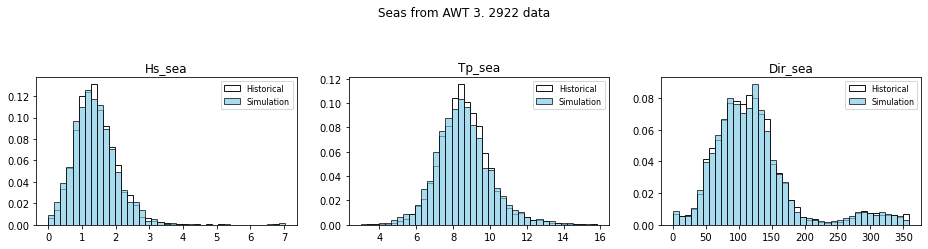
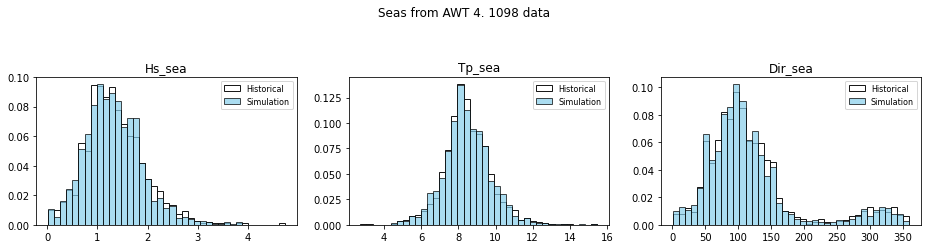
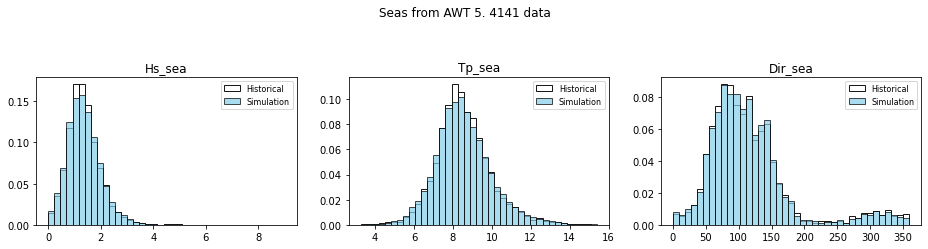
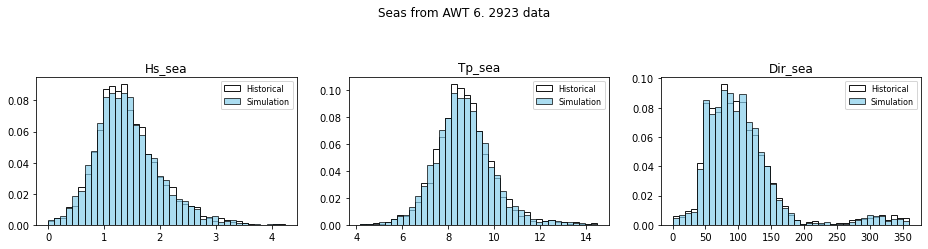
10.5.2. Validate emulator: Seas by AWT#
# historical
awt_his = xr.open_dataset(awt_his_file)

AWT_his = xr.Dataset({'bmus':(('time'), awt_his.bmus.values)},
    coords = {'time':(('time'), awt_his.time.values)})

AWT_his = AWT_his.resample(time='1D').pad()


seas_his = seas.copy(deep=True)
seas_his = seas_his.rename({'hs':'Hs_sea', 'tp':'Tp_sea', 'dpm':'Dir_sea'})


AWT_his = AWT_his.sel(time=slice(seas_his.time.values[0], seas_his.time.values[-1]))
seas_his = seas_his.sel(time=slice(AWT_his.time.values[0], AWT_his.time.values[-1]))
seas_his['wt'] = (('time'), AWT_his.bmus.values)
# simulation

AWTs_sim_n = AWTs_sim.isel(n_sim=n_sim)

seas_sim = sea_params_sim.copy(deep=True)

seas_sim['wt'] = (('time'), AWTs_sim_n.evbmus_sims.values)
# plot seas by AWT

for wt in range(6):

    seas_his_wt = seas_his.where(seas_his.wt==wt, drop=True)
    seas_sim_wt = seas_sim.where(seas_sim.wt==wt+1, drop=True)

    seas_sim_wt = seas_sim_wt.drop({'evbmus_sims','wt','evbmus_sims_awt'})

    plot_his_sim_waves_hist(seas_his_wt, seas_sim_wt, title='Seas from AWT ' +  str(wt+1) + '. ' + str(len(seas_his_wt.time)) + ' data')
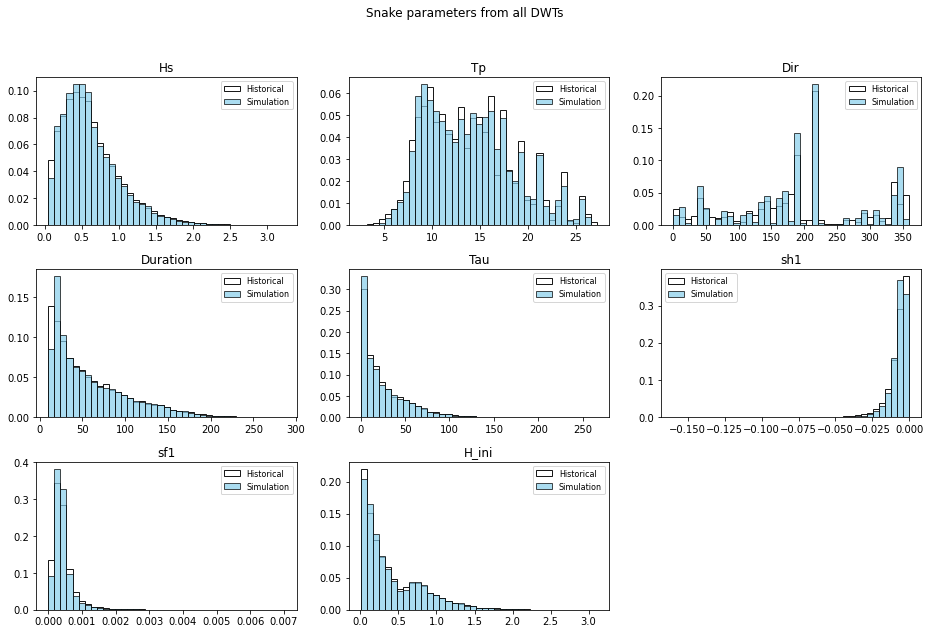
10.5.3. Validate emulator: Snakes Parameteres (daily values)#
# --------------------------------------
# Select Simulation to plot

n_sim = 39
snake_params_sim = xr.open_dataset(op.join(p_out_waves, 'snakes_params_{0:08d}.nc'.format(int(n_sim))))
# Compare historical and simulated swells (all DWTs)

snake_sim = snake_params_sim.copy(deep=True)
snake_sim = snake_sim.drop({'evbmus_sims', 'evbmus_sims_awt'})

plot_his_sim_waves_hist(snakes, snake_sim, title='Snake parameters from all DWTs')
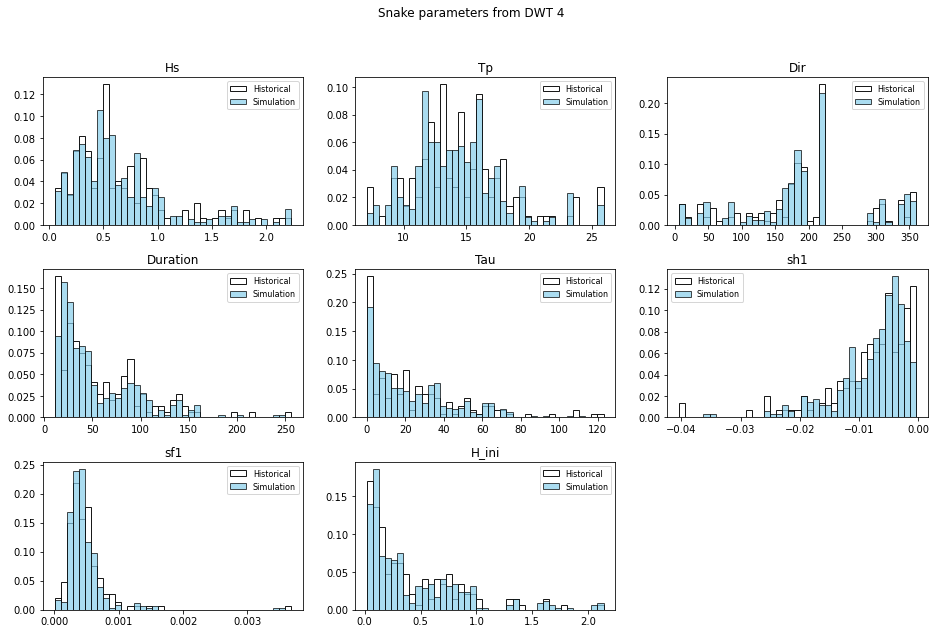
# Choose one DWT to compare all parameters
wt = 3

snake_his = snakes.copy(deep=True)
snake_his = snake_his.where(snake_his.bmus==wt)

snake_sim = snake_params_sim.copy(deep=True)
snake_sim = snake_sim.where(snake_sim.evbmus_sims==wt+1)
snake_sim = snake_sim.drop({'evbmus_sims','evbmus_sims_awt'})


plot_his_sim_waves_hist(snake_his, snake_sim, title='Snake parameters from DWT ' + str(wt+1))
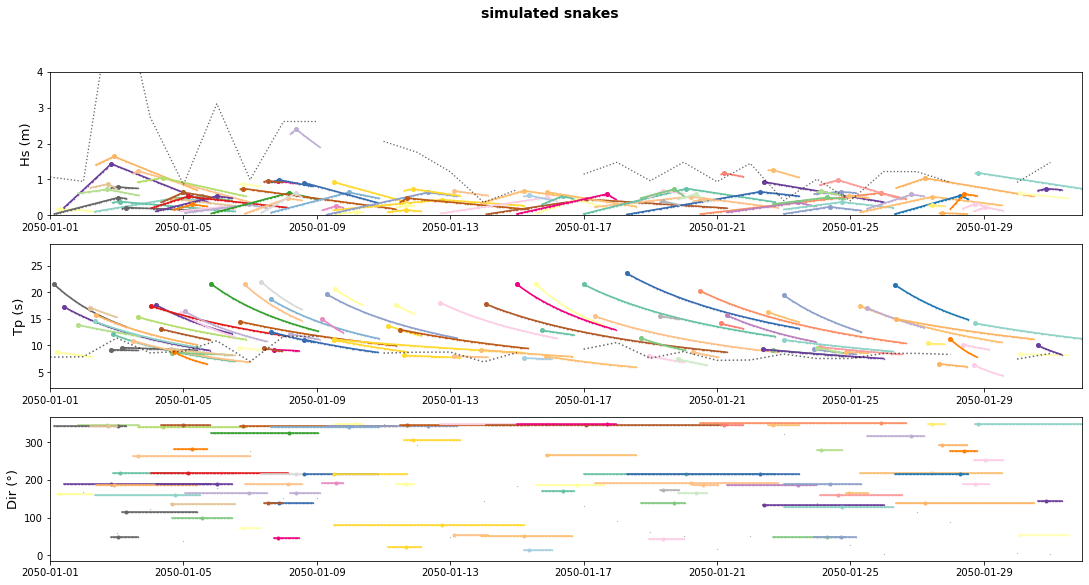
10.5.4. Plot snakes reconstruction#
#--------------------------
# Plot simulated snakes
n=39
snake_params_sim = xr.open_dataset(op.join(p_out_waves,'snakes_params_{0:08d}.nc'.format(int(n))))

# reconstruct snakes
snake_params_sim_y = snake_params_sim.sel(time=slice('2050-01-01', '2050-02-01'))
time_h, hs_swell, tp_swell, dir_swell = reconstruct_snakes(max_num_snakes, snake_params_sim_y, 'sim')

# plot
sea_params_sim_y = sea_params_sim.sel(time=slice(time_h[0], time_h[-1]))

plot_sim_snakes(time_h, hs_swell, tp_swell, dir_swell, sea_params_sim_y)
10.5.5. Plot number of swells for each DWT and each directional sector#
# define output
n_swells_sim =  xr.Dataset(
    {
        'n_swells':(('time','n_dirs'), np.zeros((len(snake_params_sim.time.values), len( n_swells.n_dirs.values)))*np.nan),
        'bmus':(('time'), np.zeros((len(snake_params_sim.time.values)))*np.nan),
    },
    coords = {
        'time':(('time'), snake_params_sim.time.values),
        'n_dirs':(('n_dirs'), n_swells.n_dirs.values),
    },
)

# bins dir
dir_ini = n_swells_sim.n_dirs.values
dir_end =  np.append(n_swells_sim.n_dirs.values[1:], 360.01)

# snakes for each day
for ind_t, t in enumerate(snake_params_sim.time.values):

    snake_params_sim_d = snake_params_sim.sel(time=t)

    n_swells_sim['bmus'][ind_t] = snake_params_sim_d.evbmus_sims.values.astype('int')

    if len(np.where(~np.isnan(snake_params_sim_d.Hs))[0])>0:
        snake_params_sim_d = snake_params_sim_d.where(~np.isnan(snake_params_sim_d.Hs), drop=True)
    else:
        continue   # there are no snakes that day


    # snakes/day for each dir
    n_swells_dir = np.zeros((len(n_swells.n_dirs), max_num_snakes))

    cont=0
    for s in snake_params_sim_d.n_snake.values:
        snake_params_sim_d_s = snake_params_sim_d.isel(n_snake = s)

        for ind_dir in range(len(n_swells_sim.n_dirs)):

            if snake_params_sim_d_s.Dir.values>=dir_ini[ind_dir] and snake_params_sim_d_s.Dir.values<dir_end[ind_dir]:
                n_swells_dir[ind_dir,cont] = 1
                cont = cont+1

    n_swells_sim['n_swells'][ind_t,:] = np.sum(n_swells_dir, axis=1)


# save
n_swells_sim.to_netcdf(n_swells_file_sim)
n_swells_sim = xr.open_dataset(n_swells_file_sim)
plot_his_sim_NumSnakes(n_swells, n_swells_sim);
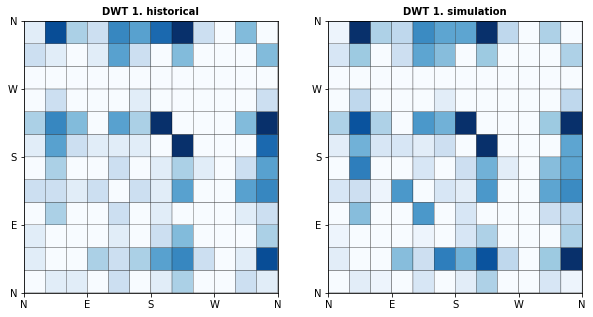
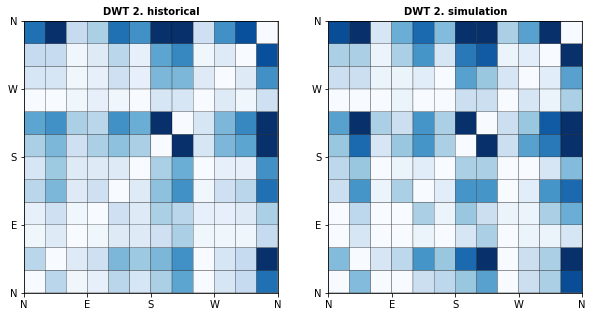
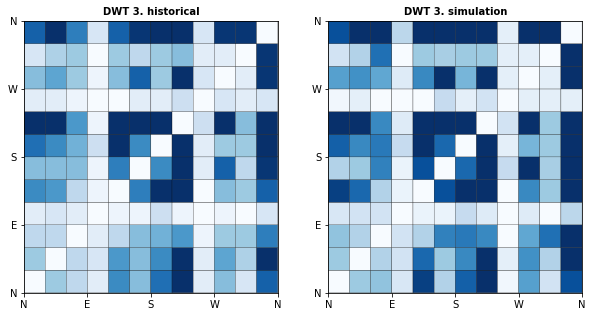
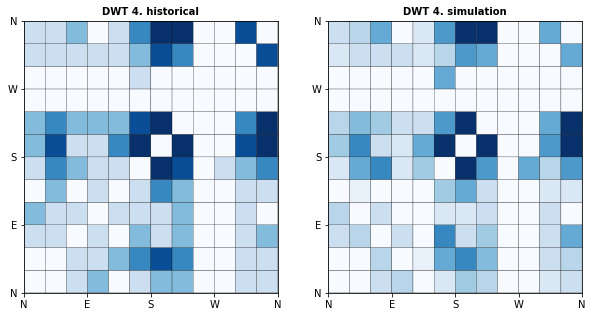
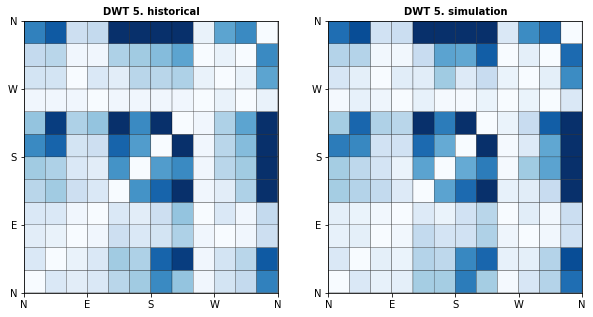
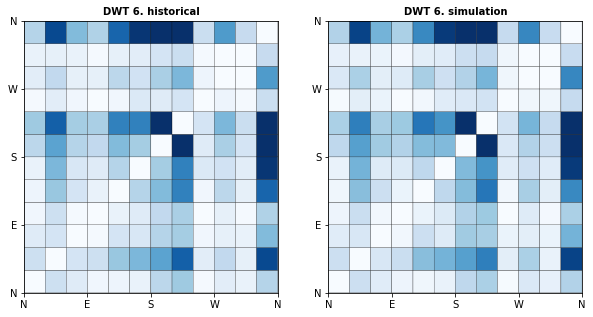
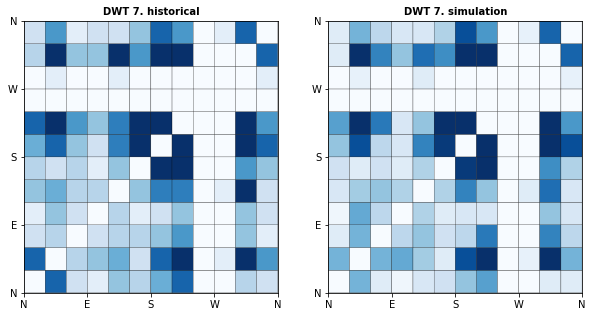
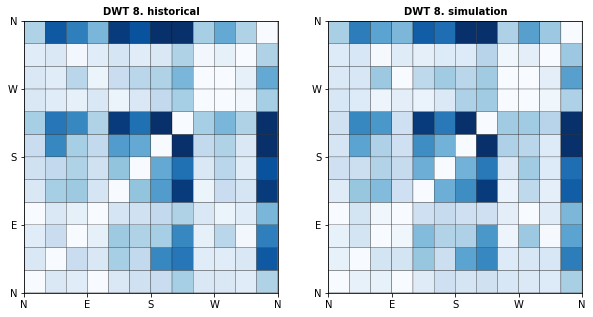
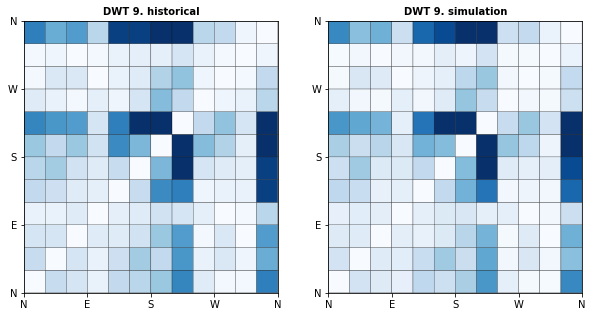
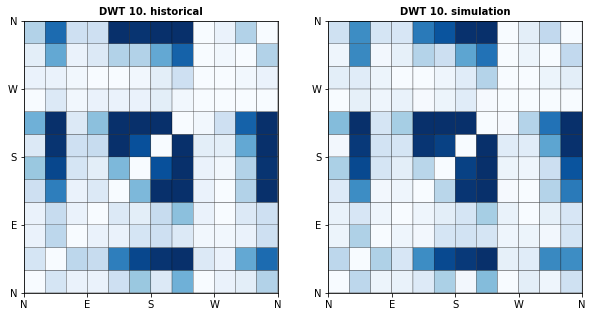
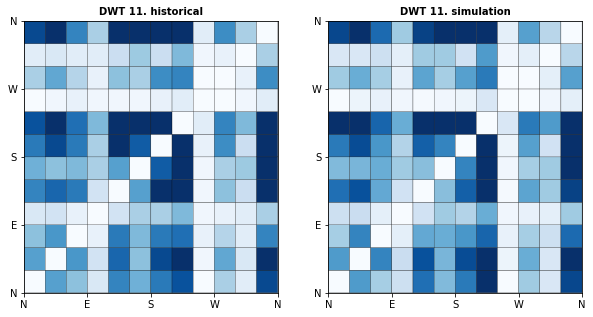
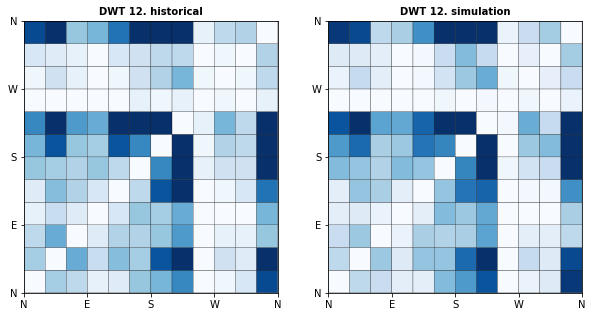
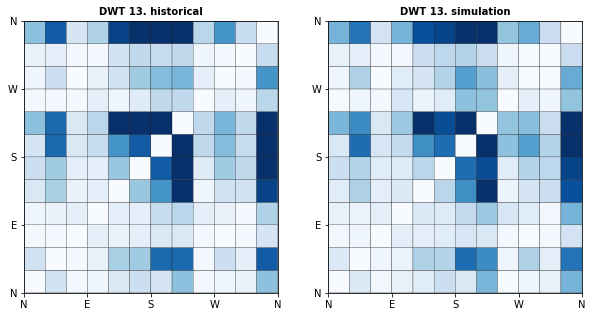
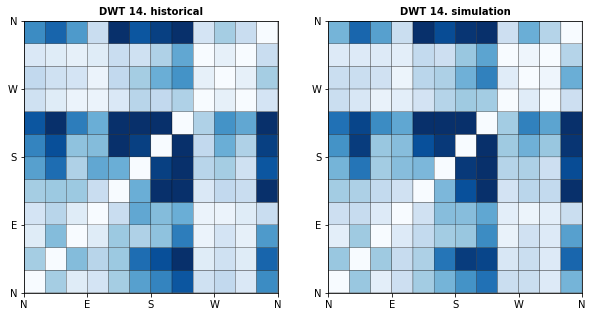
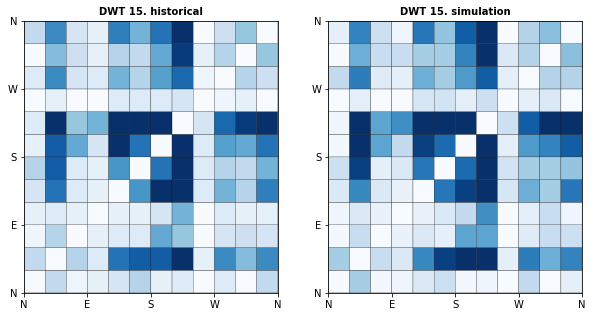
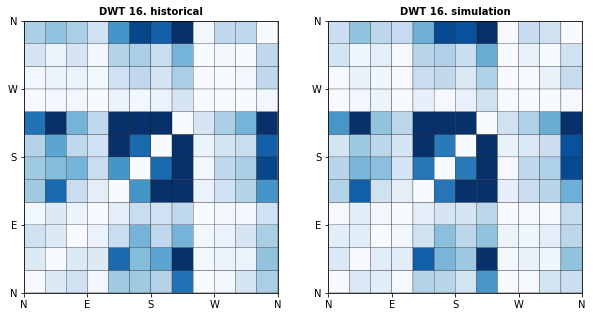
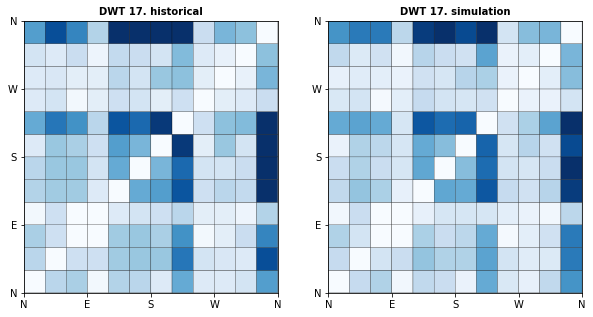
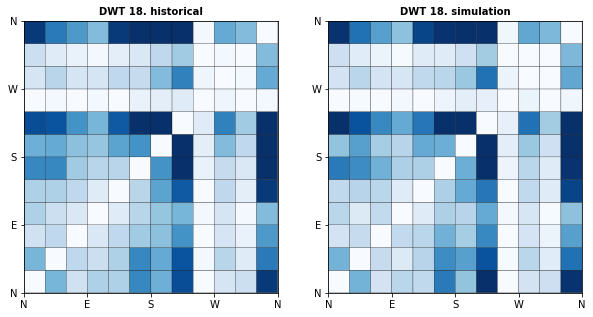
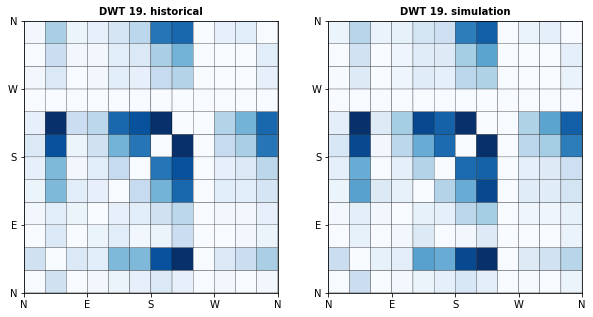
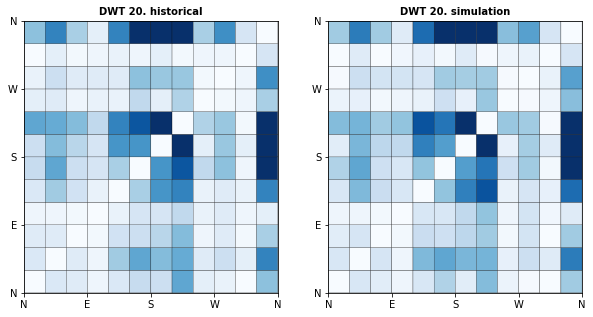
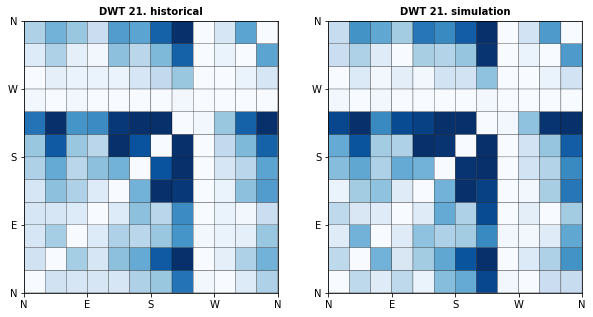
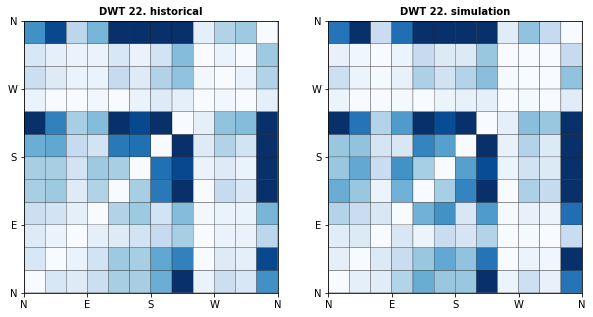
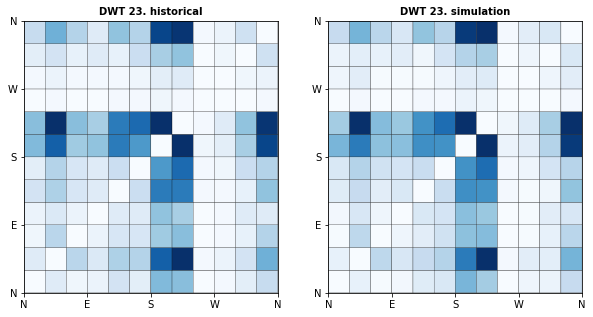
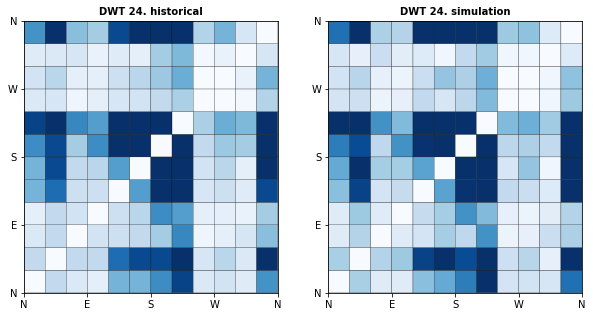
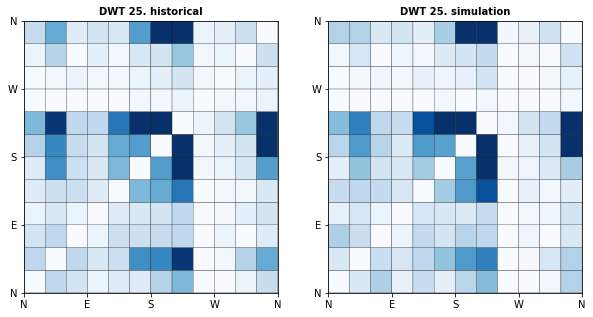
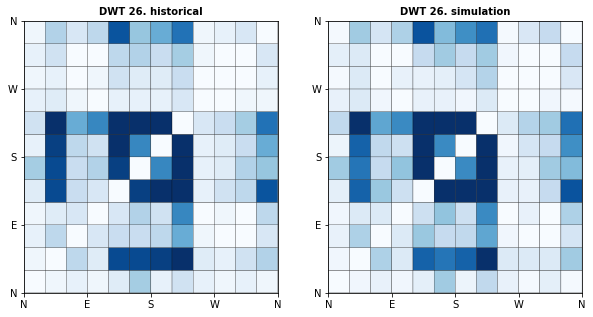
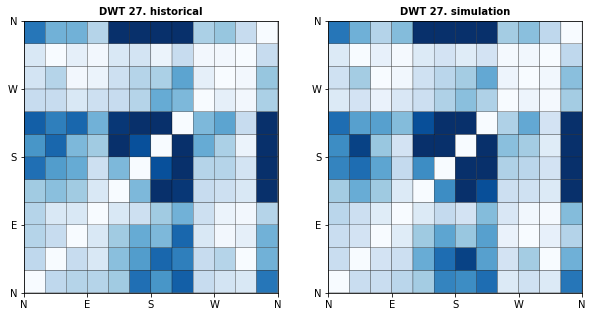
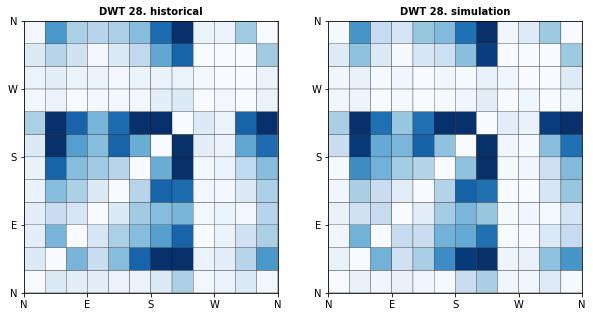
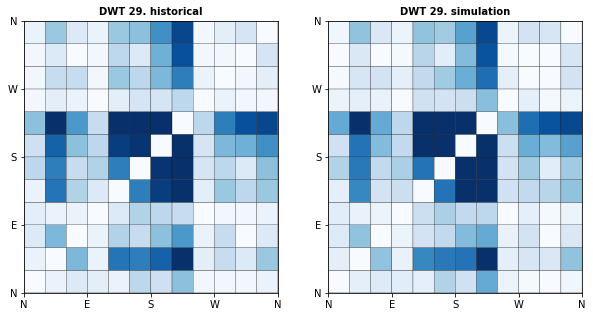
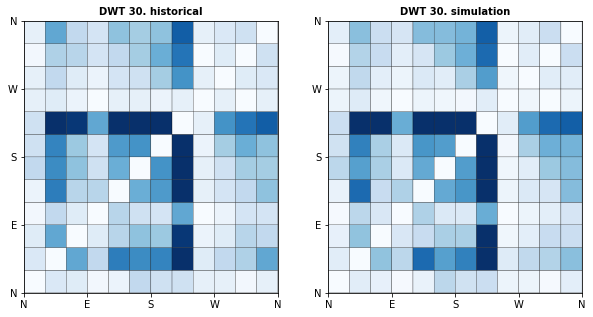
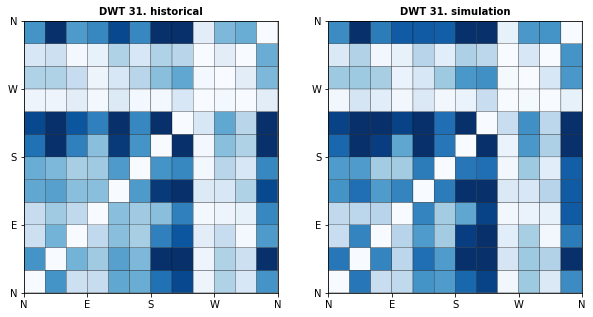
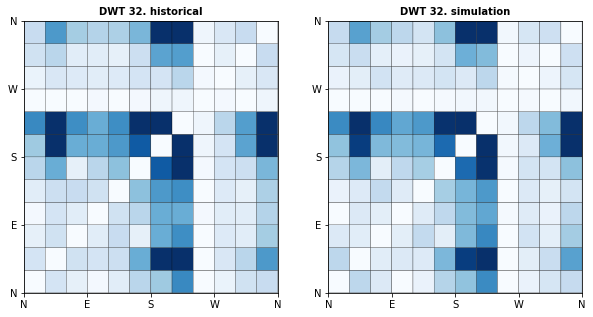
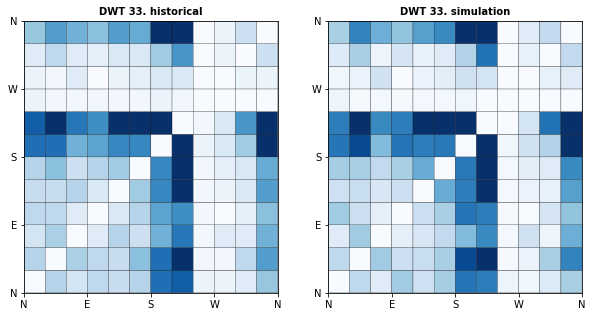
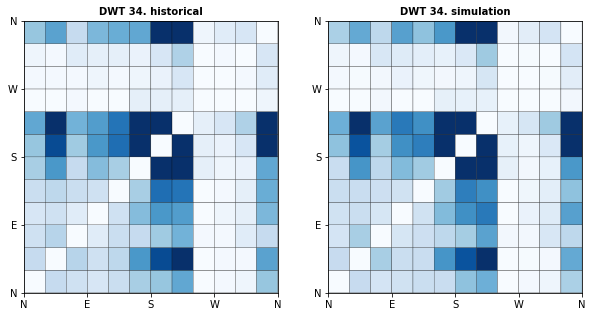
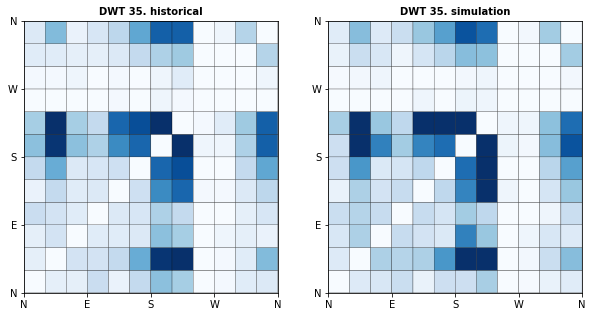
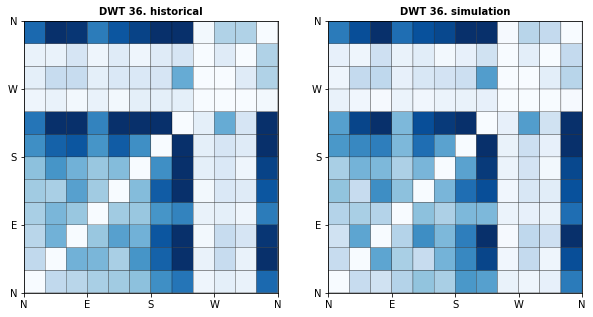
10.5.6. Plot probability of swells for DWT and direction#
# historical
out_his = np.full((n_clusters,12,12), 0)

for wt in range(n_clusters):
    n_swells_wt = n_swells.where(n_swells.bmus==wt, drop=True)

    for t in n_swells_wt.time.values:
        n_swells_wt_t = n_swells_wt.sel(time=t)
        ind = np.where(n_swells_wt_t.n_swells!=0)

        for pair in itertools.permutations(ind[0],2):
            out_his[wt, pair[0], pair[1]] = out_his[wt, pair[0], pair[1]] + 1


# simulation
out_sim = np.full((n_clusters,12,12), 0)

for wt in range(n_clusters):
    n_swells_wt = n_swells_sim.where(n_swells_sim.bmus==wt+1, drop=True)

    for t in n_swells_wt.time.values:
        n_swells_wt_t = n_swells_wt.sel(time=t)
        ind = np.where(n_swells_wt_t.n_swells!=0)

        for pair in itertools.permutations(ind[0],2):
            out_sim[wt, pair[0], pair[1]] = out_sim[wt, pair[0], pair[1]] + 1
for wt in range(n_clusters):
    out_his_wt = out_his[wt,:,:]
    out_sim_wt = out_sim[wt,:,:]

    max_his = np.max(out_his_wt)
    max_sim = np.max(out_sim_wt)

    out_his_wt = out_his_wt/max_his
    out_sim_wt = out_sim_wt/max_sim


    fig, ax = plt.subplots(1,2, figsize=(10,5))

    axplot_WT_Probs(ax[0], np.flipud(out_his_wt),
                     ttl = 'DWT ' + str(wt+1) + '. historical', vmin = 0, vmax = 0.5,
                     cmap = 'Blues', caxis='black')
    ax[0].set_xticks([0,3,6,9,12])
    ax[0].set_xticklabels(['N','E','S','W','N'])
    ax[0].set_yticks([0,3,6,9,12])
    ax[0].set_yticklabels(['N','E','S','W','N'])

    axplot_WT_Probs(ax[1], np.flipud(out_sim_wt),
                     ttl = 'DWT ' + str(wt+1) + '. simulation', vmin = 0, vmax = 0.5,
                     cmap = 'Blues', caxis='black')
    ax[1].set_xticks([0,3,6,9,12])
    ax[1].set_xticklabels(['N','E','S','W','N'])
    ax[1].set_yticks([0,3,6,9,12])
    ax[1].set_yticklabels(['N','E','S','W','N'])
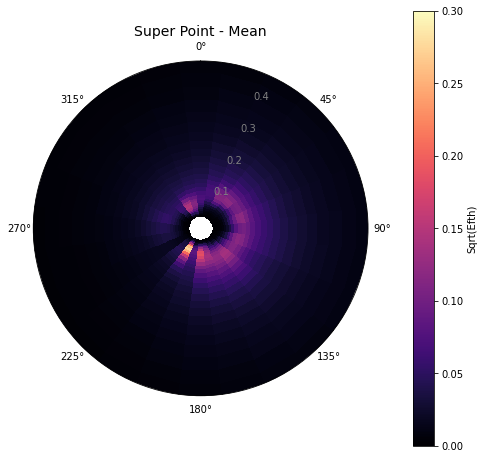
10.5.7. Validates Spectrum reconstruction#
# Average spectrum

for n in DWTs_sim.n_sim.values:
    print(n)
    for yy in range(2020,2100):
        spectro_yy = xr.open_dataset(op.join(p_out_spec,'spectrum_hourly_{0:08d}_{1}.nc'.format(int(n),yy)))
        spectro_yy_mean = spectro_yy.mean(dim='time')

        if yy==2020:
            spectro_mean = spectro_yy_mean.copy(deep=True)
        else:
            spectro_mean = xr.concat([spectro_mean, spectro_yy_mean], dim='year')

    if n==0:
        spectro_sim = spectro_mean.mean(dim='year')
    else:
        spectro_sim = xr.concat([spectro_sim, spectro_mean.mean(dim='year')],'n_sim')


# mean of all sims
spectro_sim = spectro_sim.mean(dim='n_sim')
spectro_sim.to_netcdf(mean_spec_file_sim)
spectro_sim = xr.open_dataset(mean_spec_file_sim)
# Plot mean spectra

# historical
spectro_his = xr.open_dataset(superpoint_file)
Plot_superpoint_spectrum(spectro_his, average=True);


# simulated
spectro_sim = spectro_sim.expand_dims(dim='time')
Plot_superpoint_spectrum(spectro_sim.transpose('time', "freq", "dir"), average=False); # already averaged

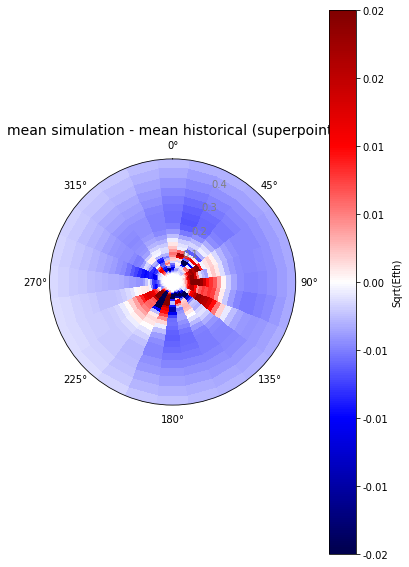
# Plot mean differences
mean_dif = np.sqrt(spectro_sim.efth.isel(time=0).transpose("freq", "dir")) - np.sqrt(spectro_his.efth.mean(dim='time'))

# reconstructed from partitions
fig = plt.figure(figsize = (20,10))
ax = fig.add_subplot(1,3,1, projection = 'polar')
axplot_spectrum(ax, np.deg2rad(spectro_his.dir.values), spectro_his.freq.values, mean_dif.values, vmin = -.02,  vmax=0.02, cmap='seismic')
ax.set_title('mean simulation - mean historical (superpoint)', fontsize=14);