Astronomical Tide
Contents
2. Astronomical Tide#
Simulate Astronomical Tide (AT) using U-tide library
inputs required:
Sea Level (SL) historical time series at the study site
in this notebook:
Tidal armonic analysis based on U-tide library
Workflow:

Tides are simulated by determining the leading constituents using the U_Tide package applied to observed water levels. Superimposing the predicted tides as an independent process still inherently accounts for the timing of events during the calendar year (i.e., king tides in January and February due to Earth’s orbital position are associated with realistic winter weather patterns produced by the emulator).
#!/usr/bin/env python
# -*- coding: utf-8 -*-

# basic import
import os
import os.path as op

# python libs
import numpy as np
import xarray as xr
from datetime import datetime
import matplotlib
import matplotlib.pyplot as plt
import geopandas as gpd

# custom libs
import utide # https://github.com/wesleybowman/UTide

# DEV: override installed teslakit
import sys
sys.path.insert(0, op.join(os.path.abspath(''), '..','..', '..','..'))

# teslakit
from bluemath.teslakit2.io.aux import save_nc
from bluemath.teslakit2.plotting.tides import Plot_WaterLevel, Plot_AstronomicalTide, Plot_ValidateTTIDE
Warning: ecCodes 2.21.0 or higher is recommended. You are running version 2.20.0
2.1. Files and paths#
# project path
p_data =  r'/media/administrador/HD2/SamoaTonga/data'
site = 'Samoa'
p_site = op.join(p_data, site)

# deliverable folder
p_deliv = op.join(p_site, 'd09_TESLA')

# output path
p_out = op.join(p_deliv,'TIDE')
if not os.path.isdir(p_out): os.makedirs(p_out)

TG_id = 'h401b' # Apia --> for simulating AT
#TG_id = 'h056a' # Pago Pago (American Samoa) --> for obtaining MMSL

# input data
TG_file = op.join(p_deliv,'resources', TG_id + '.nc')
coastline_gshhg = op.join(p_deliv,'resources','gshhg-shp-2.3.7', 'GSHHS_shp', 'h','GSHHS_h_L1.shp')

# output data
AT_hist_file = op.join(p_out,'tide_astro_hist_' + TG_id + '.nc') # historical AT from TG
AT_sim_file = op.join(p_out,'tide_astro_sim_' + TG_id + '.nc') # simulated AT
2.2. Parameters#
# --------------------------------------
# Load historical sea level at tide gauge and set simulation dates

HIST_WLs = xr.open_dataset(TG_file)  # water levels from tidal gauge record, research quality
print(HIST_WLs.station_name.values)
WLs = HIST_WLs.sea_level[0,:]

# TG latitude
lat0 = HIST_WLs.lat.values
print(lat0)

# Simulation dates (years)
y1_sim = 2020
y2_sim = 2100
[b'Apia']
[-13.82]
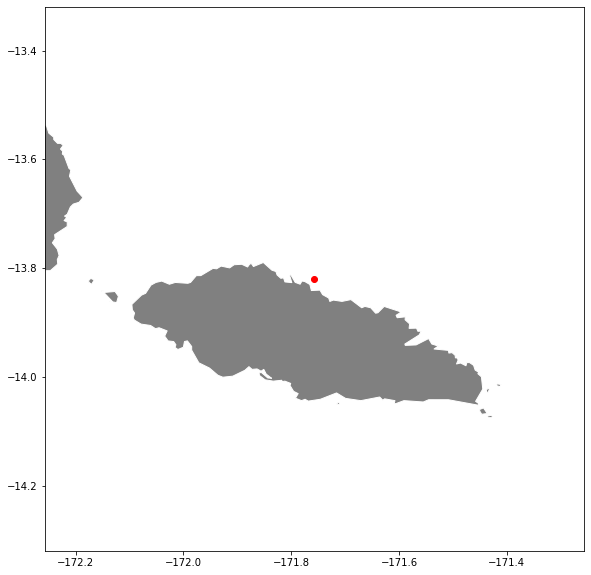
 # Plot TG location
lon0 = HIST_WLs.lon.values
if lon0>180: lon0-=360

map_data = gpd.read_file(coastline_gshhg);
fig, ax = plt.subplots(figsize=[10,10]);
map_data.plot(ax=ax,color='grey',edgecolor='white',zorder=2);

plt.plot(lon0,lat0,'ro')
plt.axis([lon0-.5,lon0+.5,lat0-.5,lat0+.5]);
(-172.2570037841797,
 -171.2570037841797,
 -14.319999694824219,
 -13.319999694824219)
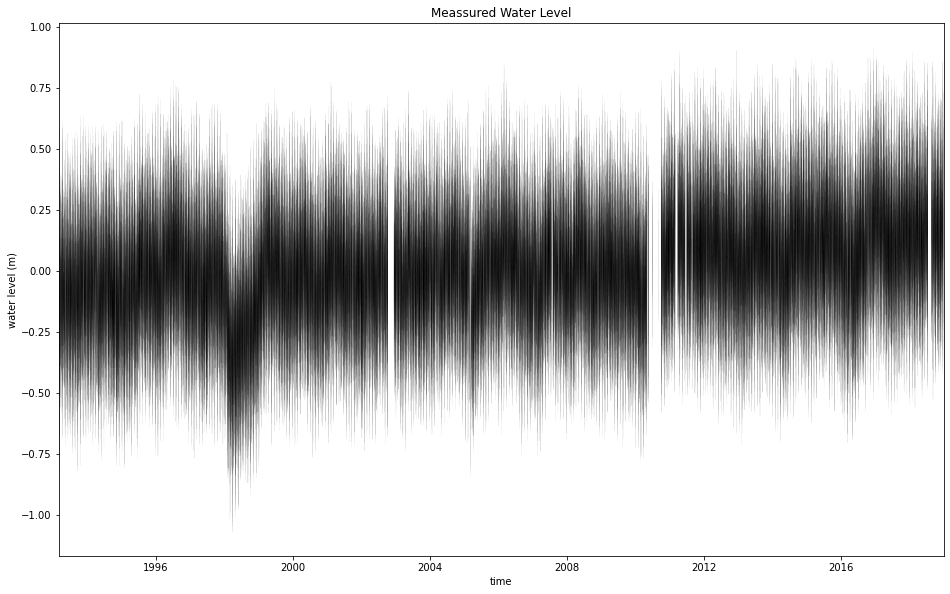
2.3. Measured water levels from tidal gauge#
# --------------------------------------
# astronomical tide data

# remove water level nanmean to obtain anomaly
WLs = (WLs - np.nanmean(WLs))/1000

# Plot astronomical tide
time = WLs.time.values[:]
wl = WLs.values[:]

Plot_WaterLevel(time, wl);
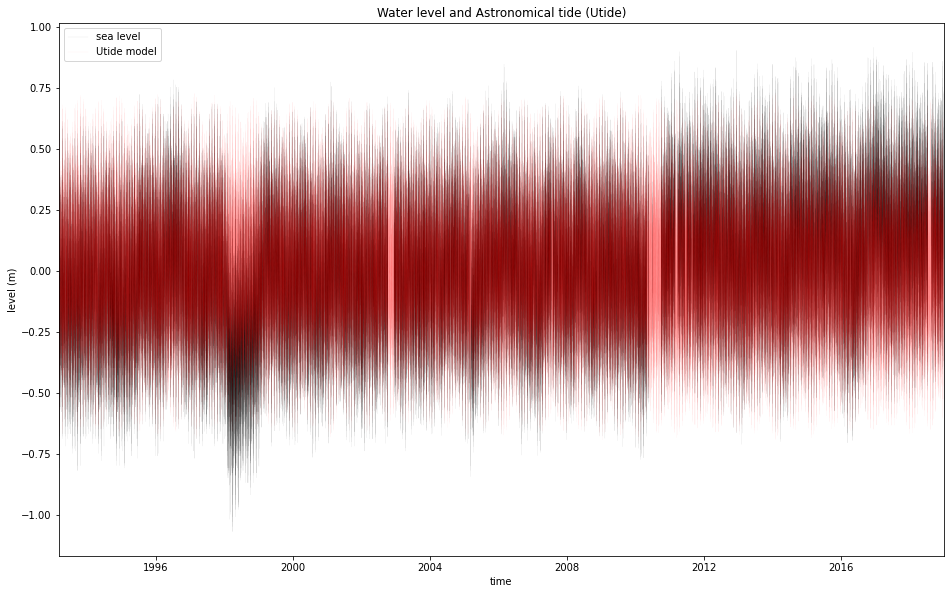
2.4. Astronomical Tide - Fitting#
# --------------------------------------
# Utide library - Validation
coef = utide.solve(
matplotlib.dates.date2num(time), wl,
lat=lat0,
nodal=True,
method='ols',
conf_int='MC',
trend=False,
)
tide_tt = utide.reconstruct(matplotlib.dates.date2num(time), coef).h
residuals = wl - tide_tt
# Plot
Plot_ValidateTTIDE(time, wl, tide_tt);
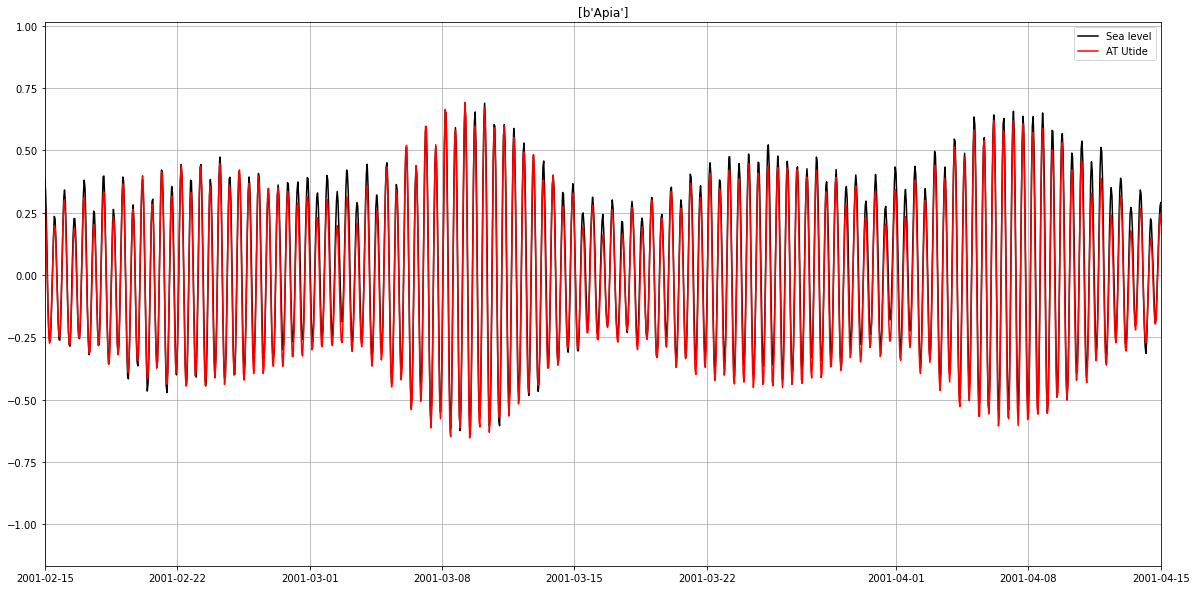
# Plot zoom
plt.figure(figsize=(20,10))
plt.plot(time, wl, 'k', label='Sea level')
plt.plot(time, tide_tt,'r', label='AT Utide')
plt.legend()
plt.xlim(datetime(2001,2,15), datetime(2001,4,15))
plt.grid()
plt.title(HIST_WLs.station_name.values)
solve: matrix prep ... solution ... done.
prep/calcs ... done.
Text(0.5, 1.0, "[b'Apia']")
2.5. Historical Predicted Tide and Residuals from water level measurements#
xds_hist = xr.Dataset(
    {
        'WaterLevels': (('time'), wl),
        'Residual': (('time'), residuals),
        'Predicted': (('time'), tide_tt),
    },
    coords = {'time': time}
)

# round times
xds_hist['time'] = xds_hist['time'].dt.round('H')

save_nc(xds_hist, AT_hist_file)
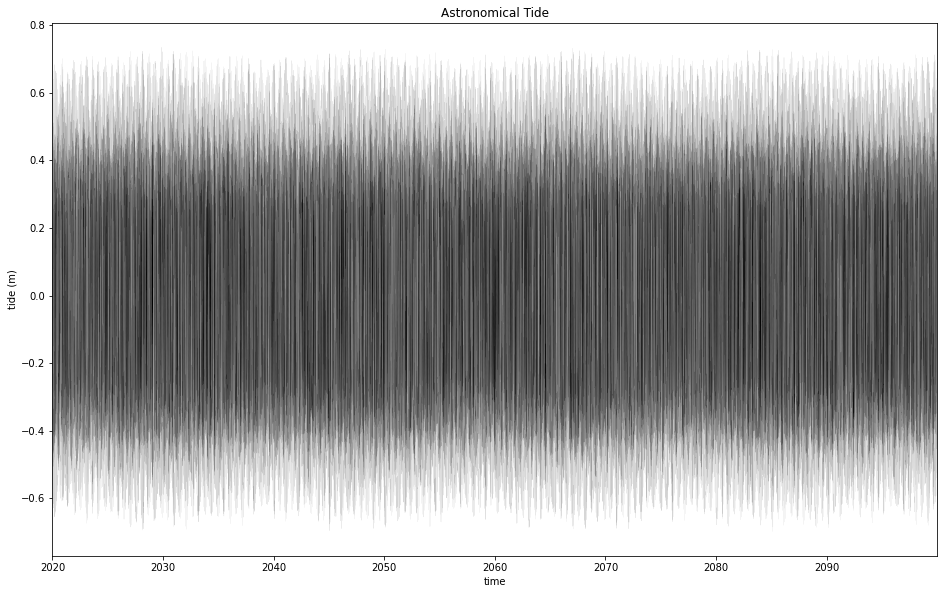
2.6. Astronomical Tide - Prediction#
# --------------------------------------
# Utide library - Prediction

def utide_pred_one_year(y):
    'Predicts one year using utide library (to avoid kernel error)'

    # make hourly array (one year)
    d_pred = np.arange(
        np.datetime64('{0}-01-01'.format(y)), np.datetime64('{0}-01-01'.format(y+1)),
        dtype='datetime64[h]'
    )

    # reconstruct tide using utide
    return utide.reconstruct(matplotlib.dates.date2num(d_pred), coef).h


# use utide for every year
atide_pred = np.concatenate([utide_pred_one_year(y) for y in range(y1_sim, y2_sim)])

date_pred = np.arange(
    np.datetime64('{0}-01-01'.format(y1_sim)), np.datetime64('{0}-01-01'.format(y2_sim)),
    dtype='datetime64[h]'
).astype(datetime)

# use xarray
ASTRO_sim = xr.Dataset({'astro' :(('time',), atide_pred)}, {'time' : date_pred})

# store astronomical tide simulation
save_nc(ASTRO_sim, AT_sim_file, safe_time=True)
# Plot astronomical tide prediction
Plot_AstronomicalTide(ASTRO_sim.time.values[:], ASTRO_sim.astro.values[:]);