From Coastline to Coastal Flooding
Contents
From Coastline to Coastal Flooding#
from datetime import datetime

print("execution start: {0}".format(datetime.today().strftime('%Y-%m-%d %H:%M:%S')))
execution start: 2022-09-13 20:09:23
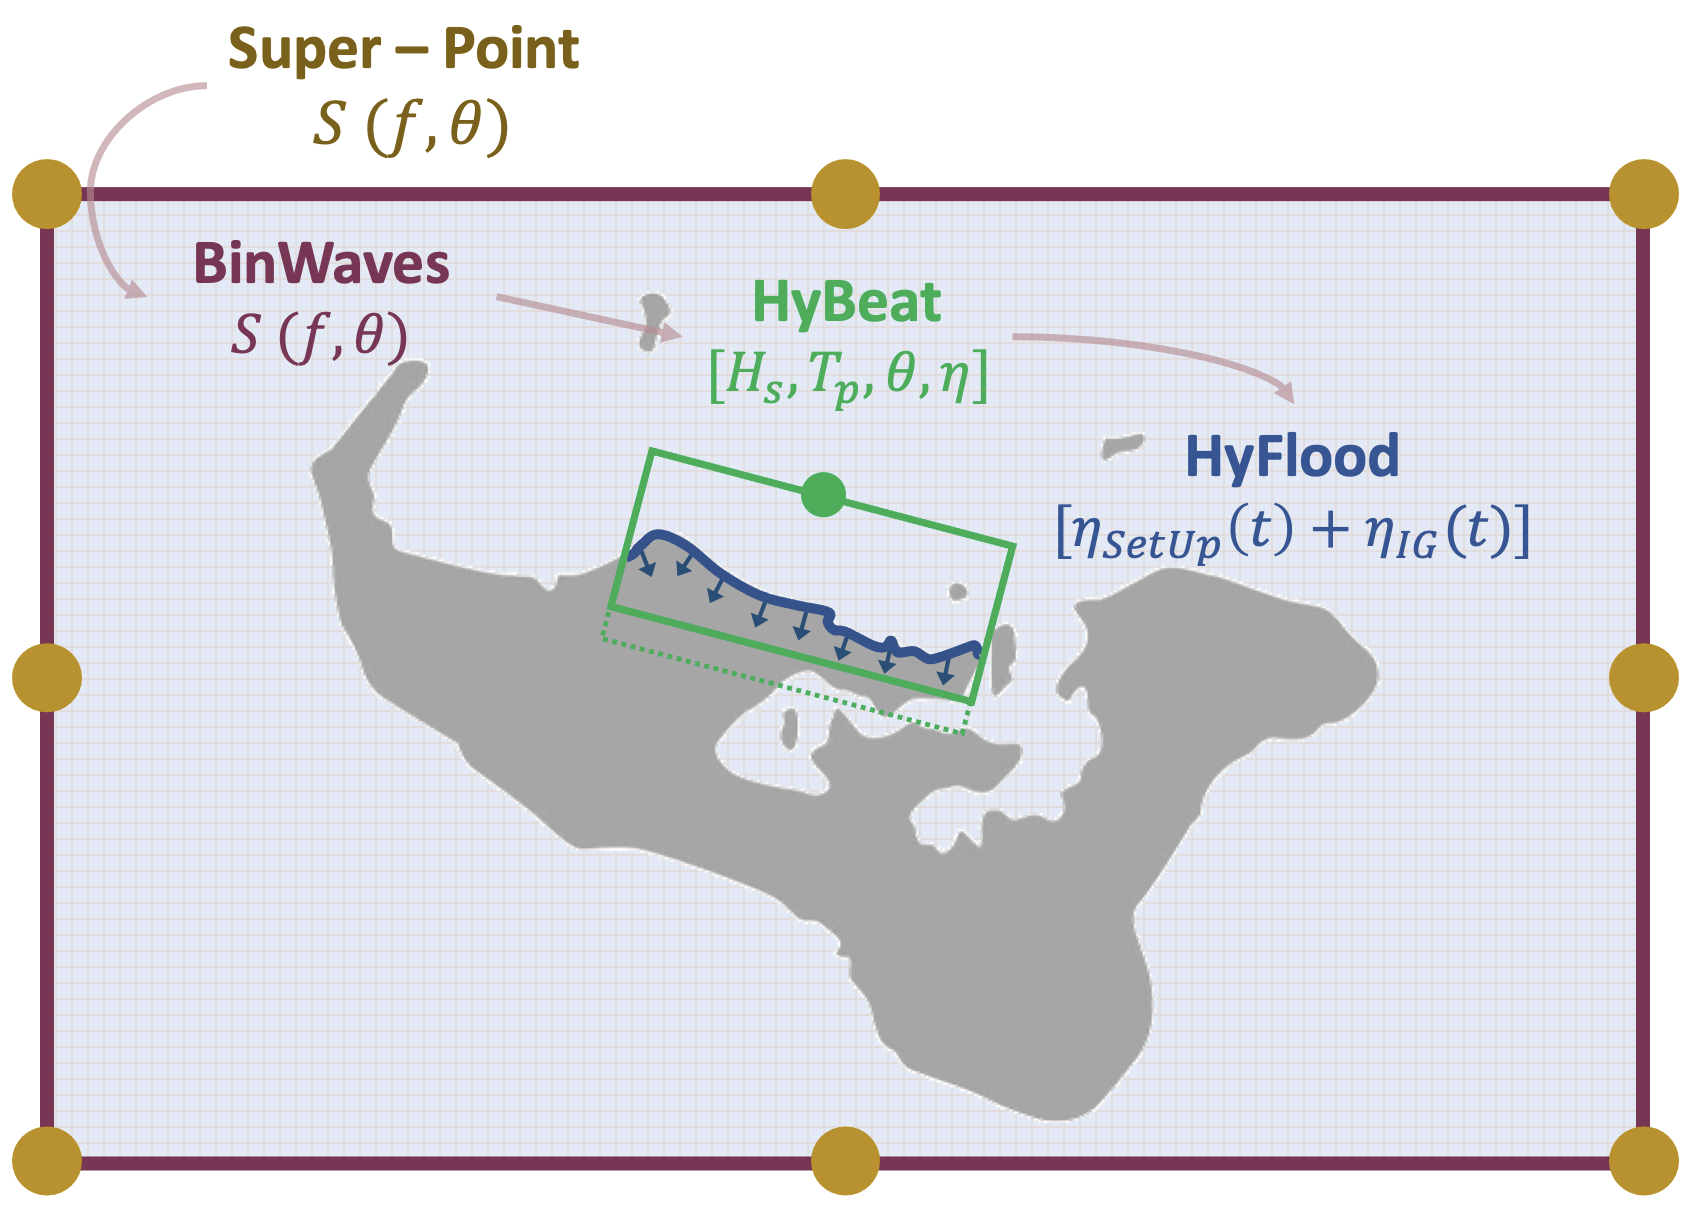
HyBeat
In this notebook we are going to focus in obtaining the flooded extents associated to the wave and level conditions obtained in the previous notebook. For that purpose we will use HyFlood, a metamodel based on Lisflood-FP numerical model each 500m along the coast.
# common
import sys
import os
import os.path as op
import glob
import time

# pip
import numpy as np
import pandas as pd
import pickle as pkl
import xarray as xr

import matplotlib
import matplotlib.pyplot as plt
from matplotlib.colors import LinearSegmentedColormap
from matplotlib import gridspec
plt.style.use('seaborn')
import pyproj
import cartopy
import cartopy.crs as ccrs
import cmocean
import earthpy.spatial as es
from scipy.signal import find_peaks

import geopandas
import xarray
import rioxarray
from pyproj import CRS

from sklearn import preprocessing
from sklearn.neighbors import KNeighborsRegressor

# bluemath
sys.path.insert(0, op.join(op.abspath(''), '..', '..'))
sys.path.insert(0, op.join(op.abspath(''), '..'))

from bluemath.astronomical_tide import calculate_AT_TPXO9v4

# reconstruction
from bluemath.rbf import RBF_Reconstruction
from bluemath.LHS import RBF_var_reconstruct
from bluemath.flood_coastal import reproject, Plot_XBeach_Transect_Colour, Plot_Transect_IDs, Plot_Map_Transects_var, \
Plot_SetUp_vars, Plot_Level_Components_Transect, Get_Flooding_Events_Parameters, \
Plot_LHS_Analogues, get_moved_meshes, Plot_Map_Z_Events_Time, Get_Flood_Maps, Plot_Flooding_Maps, Plot_Level_components

# operational utils
from operational.util import read_config_args
# hide warnings
import warnings
warnings.filterwarnings("ignore")
warnings.simplefilter("ignore")
Forecast Parameteres#
p_data = r'/media/administrador/HD2/SamoaTonga/data'
p_db = r'/media/administrador/HD1/DATABASES'
p_resources = op.join(op.abspath(''), '..', '..', 'resources')

# site = 'Tongatapu'  # Upolu / Savaii / Tongatapu

# (optional) get site from config file
nb_args = read_config_args(op.abspath(''), '05d_swell_inundation_forecast_flooding')
site = nb_args['site']

print('Study site: {0}'.format(site))
Study site: Tongatapu
# parameters
MHHW = 0.738

# Parameters for overtopping rate
b = 1 # Per meter
mu = 2
alpha = 2/3 * np.sqrt(2 * 9.81) * mu * b
if site == 'Tongatapu':

    site_g = 'Tongatapu'
    ev_date = ['1998-03-06', '1998-03-09']
    ev_date = ['2018-05-26', '2018-05-28']

    mesh_id = 'TX'
    b_x_correction = 0
    ext_island_utm = [664446, 706583, 7644909, 7679000] #Tongatapu
    ext_capital_utm = [684263, 692910, 7658223, 7663225] #Nukualofa

    moved_mesh = True
    projection = 'EPSG:32701'

    ext_xb_mesh = [660000, 716000, 7639000, 7675000]

    bathtub = np.array(np.arange(97, 188))

    gs_name = 'GFD_Tonga_T80_W40_D15_24h_CDdefault'

elif site == 'Upolu':

    site_g = 'Samoa'
    ev_date = ['2015-01-22', '2015-01-24']
    mesh_id = 'UX'
    b_x_correction = 0.02
    ext_island_utm = [376323, 459801, 8441401, 8483467] #Upolu
    ext_capital_utm = [409725, 425384 , 8469398, 8475126]

    moved_mesh = True #Calculate moved meshes for correction
    projection = 'EPSG:32702'

    bathtub = np.array(np.arange(150, 243))
    gs_name = 'GFD_Samoa_T84_W40_D15_24h_CDdefault'


elif site == 'Savaii':

    site_g = 'Samoa'
    ev_date = ['2015-01-22', '2015-01-24']
    mesh_id = 'SX'
    b_x_correction = 0.02

    ext_island_ll = [-172.897+360, -172.165+360, -13.91, -13.3798] #Savaii
    ext_island_utm = [296502, 380000, 8467406, 8517818] #Savaii
    ext_capital_utm = [341875, 355041 , 8508096, 8516201]

    moved_mesh = True #Calculate moved meshes for correction
    projection = 'EPSG:32702'

    bathtub = np.concatenate([np.array(np.arange(93, 123)), np.array(np.arange(207, 321))])
    gs_name = 'GFD_Samoa_T84_W40_D15_24h_CDdefault'
from IPython.display import Image
Image(filename = op.join(p_resources, 'images', 'sketch_hybeat_hyflood_'+site.lower()+'.png'), width=700)
Database#
# database
p_site = op.join(p_data, site_g)
# Model paths

# XBeach
p_xb = op.join(p_db, 'XBeach', 'Final_Results', site)
p_xb_mesh = op.join(p_db, 'XBeach', 'Final_Results', site, 'PCA_results')#, 'Meshes')

p_xb_bcp = op.join(p_xb, site + '_meshes_BCpoints.txt')
p_xb_ori = op.join(p_xb, site + '_meshes_Orientation.txt')
p_lf_bc = op.join(p_xb, 'shore_LFpoints_XBmeshes.xyz')

# BinWaves
p_bathy_bw = op.join(p_data, site_g, 'bathymetry', site_g.lower() + '_smooth.nc')

# Greensurge
p_gs_lib = op.join(p_db, 'greensurge', 'GFD_lib', site_g, gs_name)
p_gs_gf = op.join(p_gs_lib, 'GF_T1_D0.nc')

# Lisflood
p_lf = op.join(p_db, 'Lisflood_Coastal')
p_lf_tr = op.join(p_lf, site, 'Shorelines', 'shore_'+site.lower()+'_transects.pkl')
p_dem = op.join(p_lf, site, site + '_5m_dem.nc')
p_lhs_lf = op.join(p_lf, 'cases50_IG.nc')
p_lf_cases = op.join(p_lf, site, 'Flood_outputs')

# AT
model_directory = op.join(p_db, 'TPX09_atlas_v4')
Forecast Output Folder#
# TC Wave and Level Forecast paths
p_forecast = op.join(p_site, 'forecast', '05_swell_inundation_system')
date = 'reforecast_{0}_{1}'.format(ev_date[0], ev_date[1])

print('date: {0}'.format(date))
date: reforecast_2018-05-26_2018-05-28
# forecast folder
p_fore_date = op.join(p_forecast, date)
print('forecast date code: {0}'.format(date))

# prepare forecast subfolders for this date
p_fore_near = op.join(p_fore_date, 'nearshore')
p_output = op.join(p_fore_near, 'flooding_{0}'.format(site))

# input file from 05c
p_in_lisflood = op.join(p_output, 'Inputs_LisFlood.nc')
p_in_xb_allvar = op.join(p_output, 'ALL_variables_XBeach_points.nc')

# output
p_out_mvmesh = op.join(p_output, 'Moved_transect_coordinates_' + site)
p_flooding_maps = op.join(p_output, 'Flooding_Maps.nc')
forecast date code: reforecast_2018-05-26_2018-05-28
Load the lisflood input from previous notebook
# Output from drivers in transect points
OUT_T = xr.open_dataset(p_in_lisflood)
XBeach boundary points
# Xbeach boundary points
coords = pd.read_csv(
    p_xb_bcp,
    delimiter = '   ',
    names = ['mesh', 'x', 'y'],
).to_xarray()

xb_meshes = range(len(coords.index))
Lisflood Transects
# Lisflood Transects
resample = 5  # just for plotting
dem = xr.open_dataset(p_dem).isel(x=slice(None, None, resample), y=slice(None, None, resample))
dem['z'] = (('y','x'),np.where(dem.z.values<0.1, np.nan, dem.z.values))

hillshade_t = es.hillshade(dem.z.values,azimuth=140,altitude=40)

# Coast + transects
transects = pkl.load(open(p_lf_tr, 'rb'))

if site_g == 'Tongatapu':
    transects[:,0] = np.round(transects[:,0],3)
elif site_g == 'Samoa':
    transects[:,:2] = np.round(transects[:,:2],1)


a = np.vstack([transects[:,0], transects[:,1], transects[:,2]]).T
df_t= pd.DataFrame(a , columns = ['x', 'y', 'lf_tr']) # 0  depth in contour points
XBeach Boundary Conditions#
ALL = xr.open_dataset(p_in_xb_allvar)
Bathymetry
# Bathymetry
bathy_bw = xr.open_dataset(p_bathy_bw)
bathy_bw['x'] = bathy_bw['x'] + b_x_correction
bathy_bw_rp = reproject(bathy_bw,  end = projection)
Lisflood Boundary Conditions#
cmap = matplotlib.cm.get_cmap('plasma')
colors_xb = cmap(np.linspace(0,1,len(xb_meshes)+1))
xy_xb = pd.read_csv(
    p_lf_bc,
    delimiter = ' ',
    names = ['x', 'y', 'xbmesh', 'lf_tr'],
)

if site == 'Tongatapu':
    xy_xb['x'] = np.round(xy_xb['x'], 3)
    transects = np.column_stack([xy_xb.x.values, xy_xb.y.values, xy_xb.lf_tr.values])
    transects = transects[np.argsort(transects[:,2]),:]

if site == 'Upolu':
    transects[:,:2] = np.round(transects[:,:2],1)
    _, i_t = np.unique(np.column_stack([transects[:,0], transects[:,1]]), axis=0, return_index = True)
    transects = transects[i_t,:]

xy_xb = xy_xb.merge(df_t, how='outer').dropna().to_xarray()
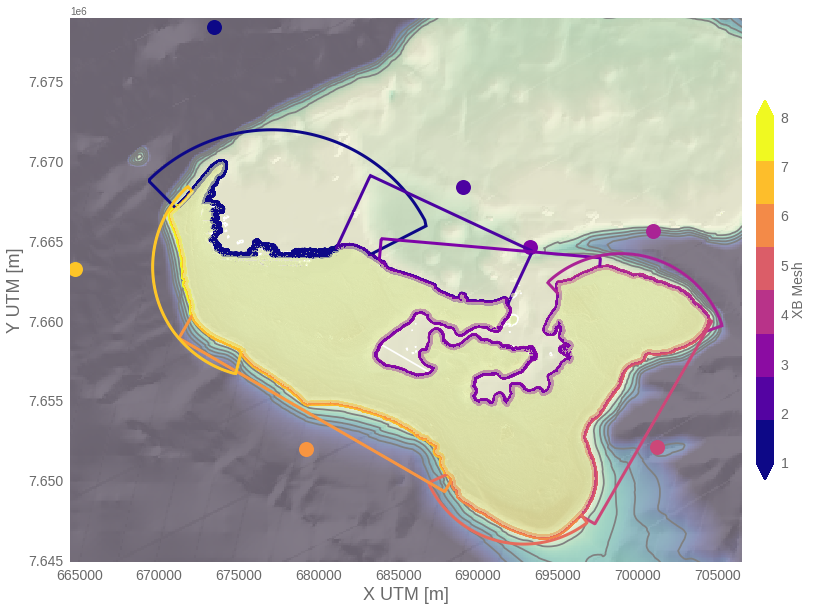
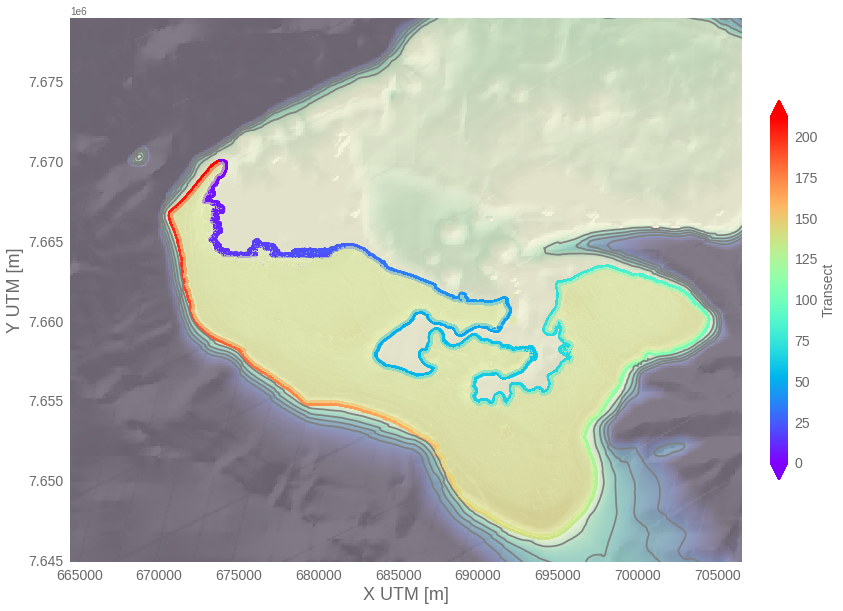
Xbeach mesh for each part of the coast
Plot_XBeach_Transect_Colour(
    xy_xb, bathy_bw_rp, dem,
    ext_island_utm, p_xb_mesh, coords,
    xb_meshes, transects,
    site=site,
)
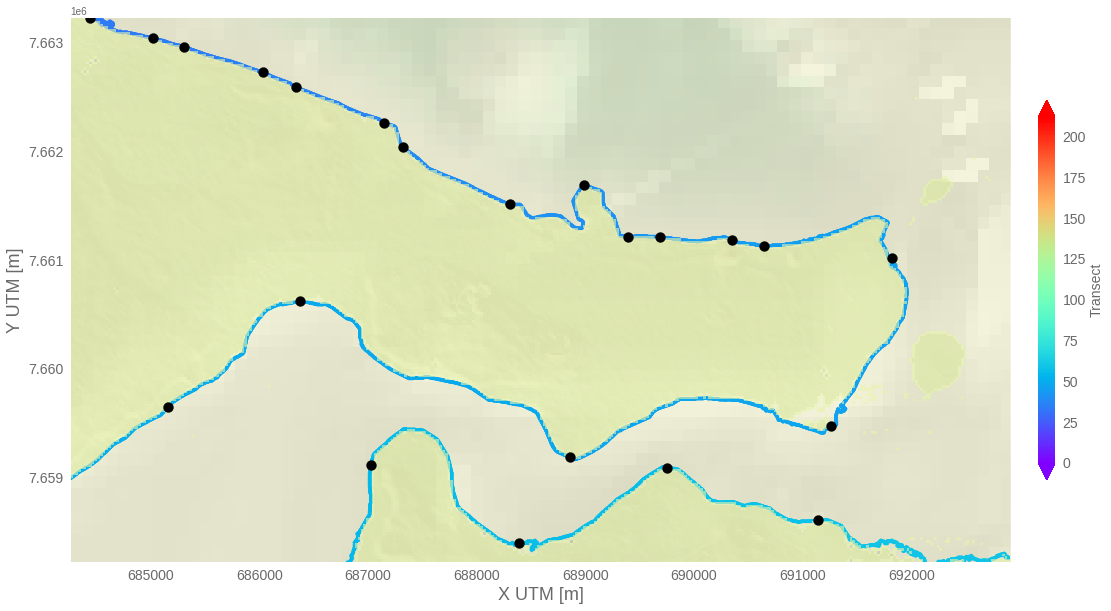
LF segments
Plot_Transect_IDs(xy_xb, transects, bathy_bw_rp, dem, ext_island_utm, site=site)
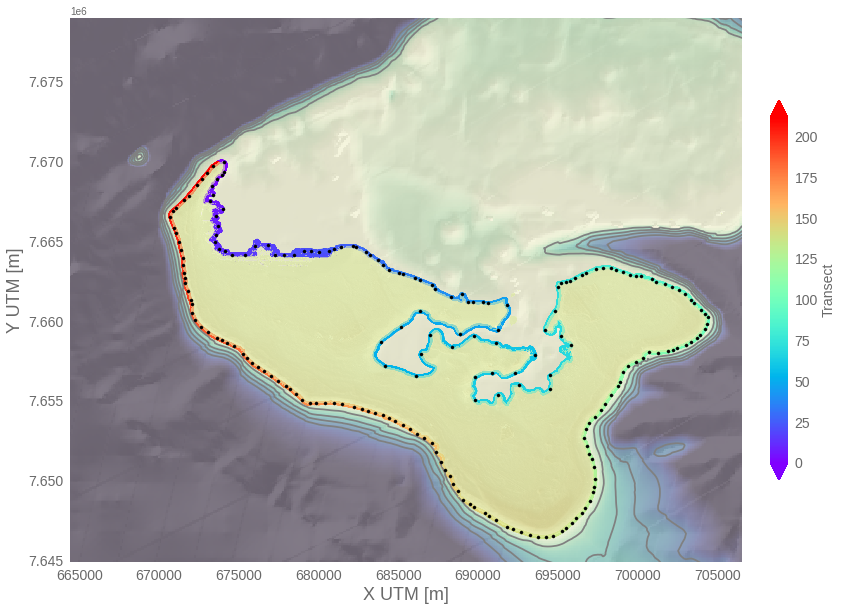
Plot_Transect_IDs(xy_xb, transects, bathy_bw_rp, dem, ext_capital_utm, site=site, mk_size=100)
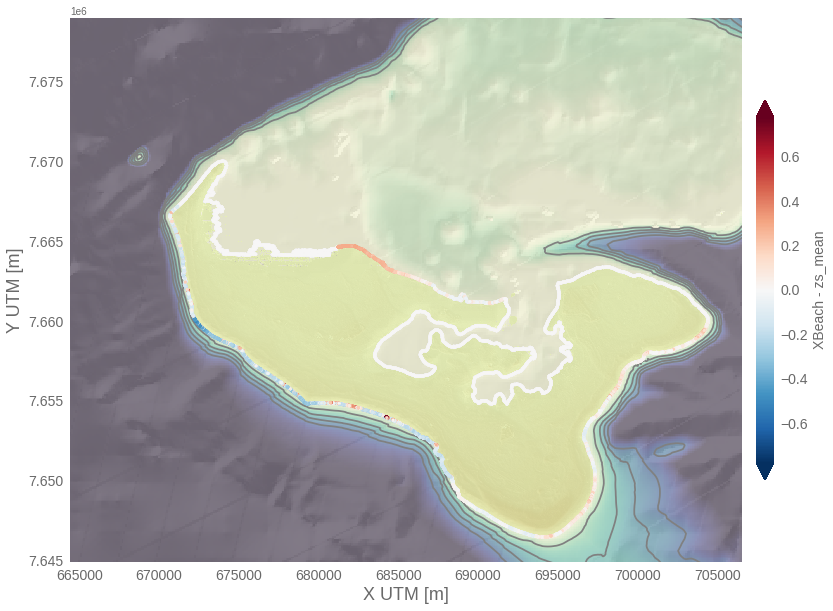
XBeach SetUp
time= 10
ext = ext_island_utm

Plot_Map_Transects_var(OUT_T, bathy_bw_rp, dem, transects, extent = ext, var = 'zs_mean', time = time, site=site)
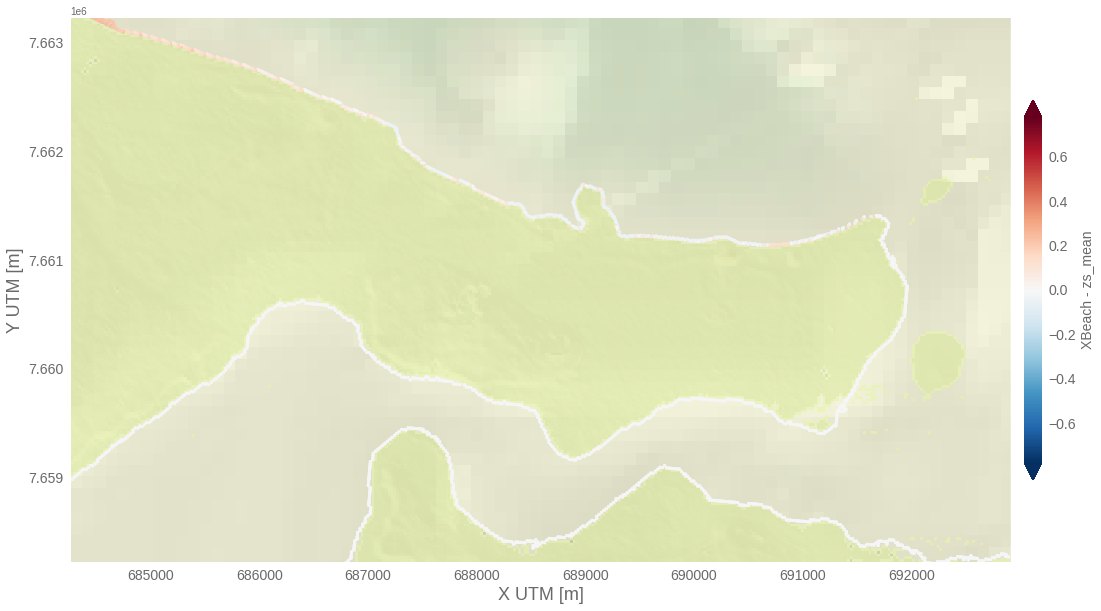
ext = ext_capital_utm

Plot_Map_Transects_var(OUT_T, bathy_bw_rp, dem, transects, extent = ext, var = 'zs_mean', time = time)
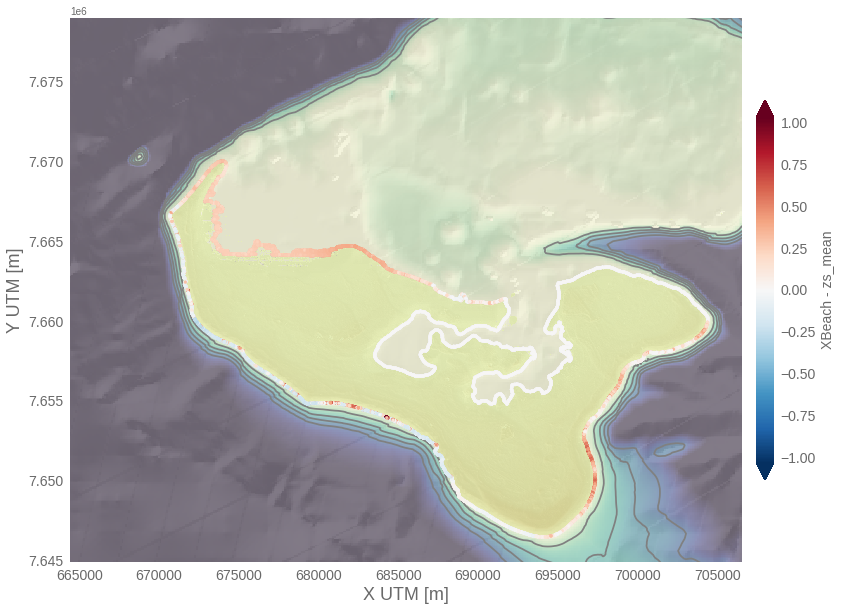
time= 'max'
ext = ext_island_utm

Plot_Map_Transects_var(OUT_T, bathy_bw_rp, dem, transects, extent = ext, var = 'zs_mean', time = time)
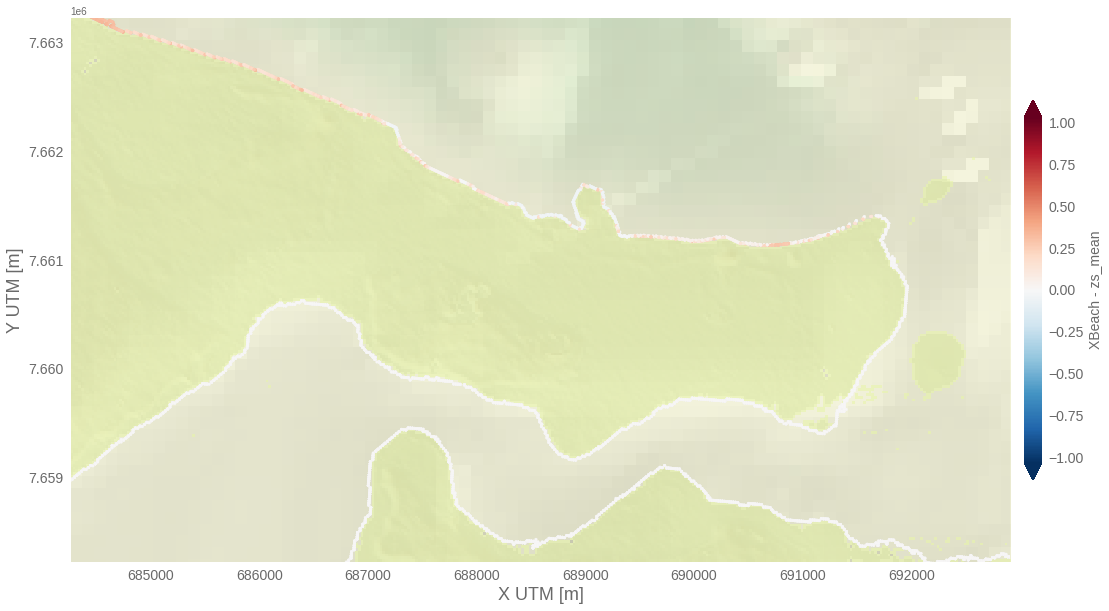
time= 'max'
ext = ext_capital_utm

Plot_Map_Transects_var(OUT_T, bathy_bw_rp, dem, transects, extent = ext, var = 'zs_mean', time = time)
Define Events#
Level_Total = AT + IB + MeanSetUp_xbeach + WindSetUp_greensurge
OUT_T['Level_Total'] = (('transect','time'),OUT_T.SWL.values + OUT_T.zs_mean.values)# + OUT_T.W_SetUp.values)
OUT_T['MHHW'] = (('transect', 'time'), np.full(np.shape(OUT_T.SWL.values), MHHW))
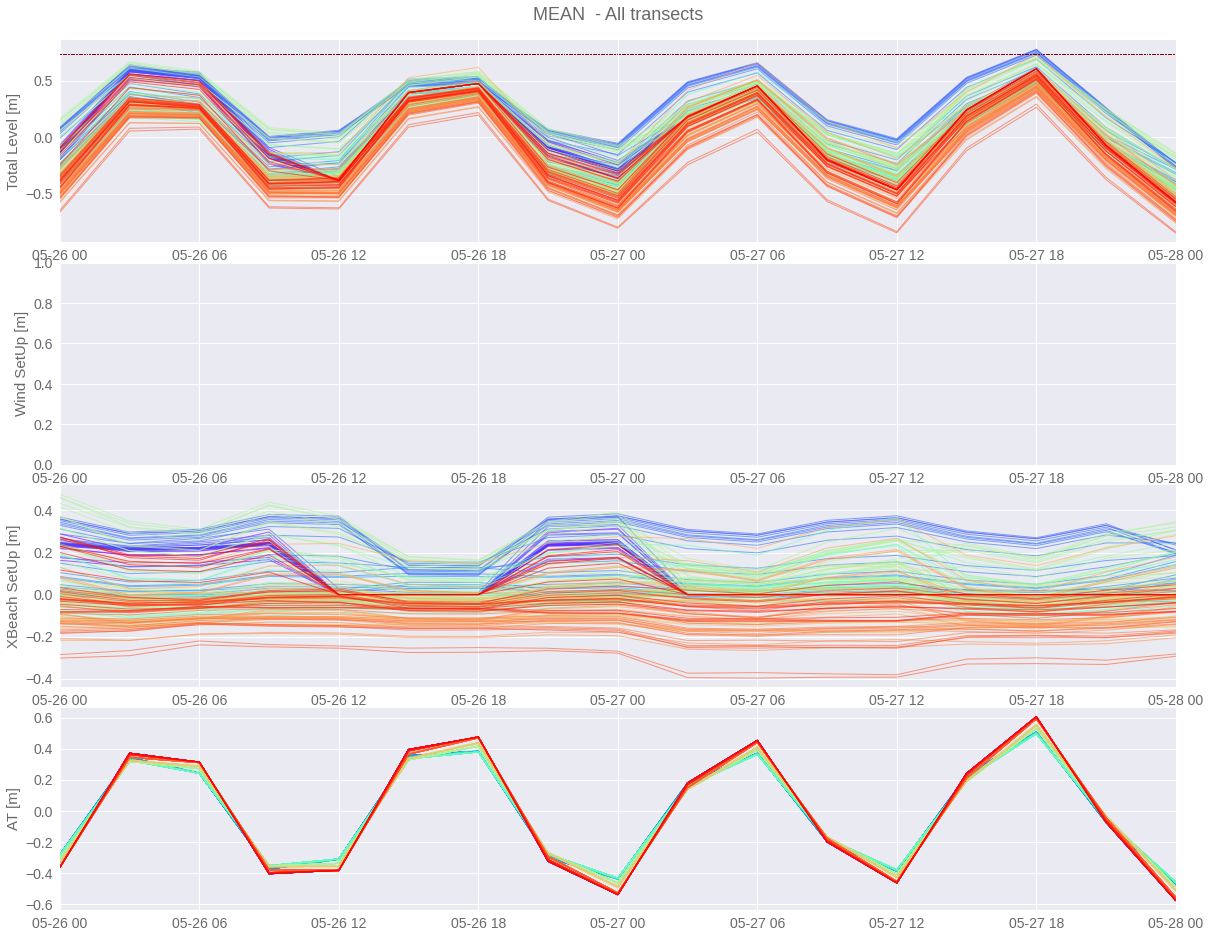
Mean values for each transect#
OUT_T_tr = OUT_T.groupby('lf_tr').mean().drop('spatial_ref')
Plot_Transect_IDs(
    xy_xb, transects, bathy_bw_rp,
    dem, ext_island_utm,
    site = site,
    mk_size_c = 20,
    mk_size = 0.001,
)

Plot_Level_components(OUT_T_tr)
LISFLOOD Metamodel#
First we have to obtain the mean boundary conditions for each LF transect
# TODO Plot_Level_Components_Transect() tr value for tongatapu

if site_g == 'Samoa':
    ax = Plot_Level_Components_Transect(OUT_T_tr, MHHW, tr=276, peaks = True);
Define Events over threshold and get its representative parameters
EVENTS_TR = Get_Flooding_Events_Parameters(OUT_T_tr, MHHW)
if len(EVENTS_TR.event.values)==0:
    print('No flooding events expected in the Area')
    sys.exit()
LHS#
lhs_lf = xr.open_dataset(p_lhs_lf)
# normalize dataset
df_LHS = lhs_lf.to_dataframe().reset_index()

df_LHS['Q'] = alpha * df_LHS['Z*'] **(3/2)
df_LHS['V'] = 0.5 * df_LHS['Q'] * df_LHS['D']*3600

min_max_scaler = preprocessing.MinMaxScaler()
X_train_minmax = min_max_scaler.fit_transform(df_LHS[['V', 'Z*', 'Asig']].values)
y = df_LHS['index']

neigh = KNeighborsRegressor(n_neighbors=3)
neigh.fit(X_train_minmax, y)

df_LHS = df_LHS.to_xarray()
Find analogue
dist, i_an = neigh.kneighbors(
    min_max_scaler.transform(np.transpose([EVENTS_TR['VT'].values, EVENTS_TR['Z*'].values, EVENTS_TR['aig'].values])),
    return_distance = True,
)

# Multiplier factor, inverse of distance
factor = np.transpose((1/dist).T/np.sum(1/dist, axis=1))

EVENTS_TR['Analogue'] = (('event', 'an_num'), i_an)
EVENTS_TR['Analogue_factor'] = (('event', 'an_num'), factor)
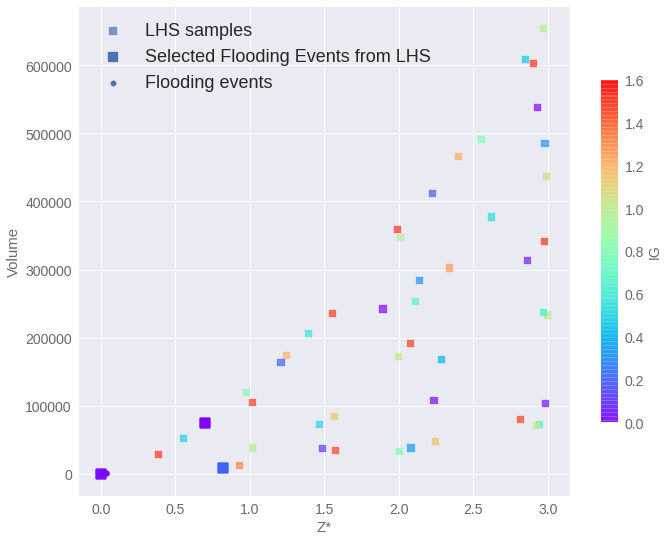
Analogues#
Plot_LHS_Analogues(df_LHS, EVENTS_TR)
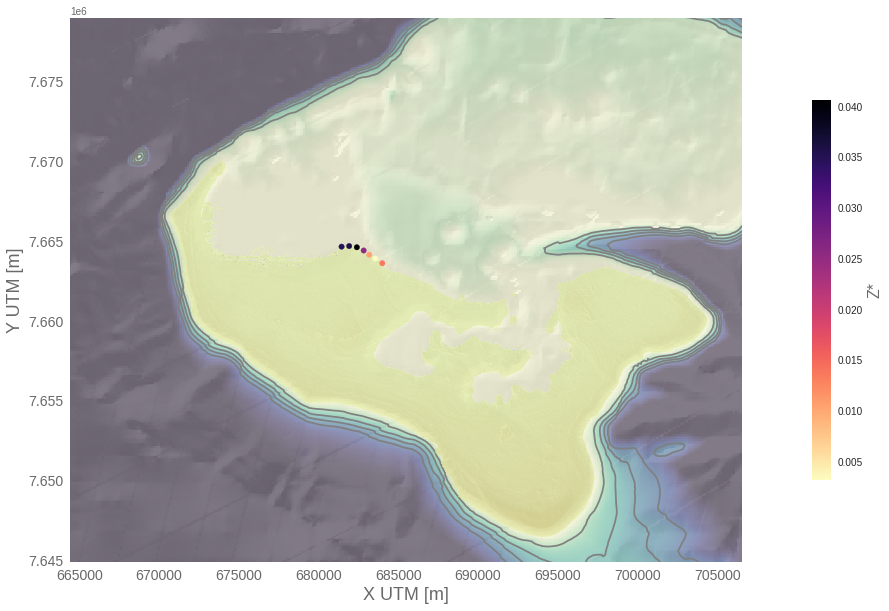
Flooding Input#
We plot the maximum flooding in a +-6h window to capture concurrent events in the different transects that have the peak time moved a maximum of 6h.
Check for moved y coordinate in transects
p_out_mvmesh
'/media/administrador/HD2/SamoaTonga/data/Tongatapu/forecast/05_swell_inundation_system/reforecast_2018-05-26_2018-05-28/nearshore/flooding_Tongatapu/Moved_transect_coordinates_Tongatapu'
# in some sites we need to move some lisflood meshes
if moved_mesh:
    moved_y_t = get_moved_meshes(transects, p_lf_cases, p_dem, site, p_out_mvmesh)
u, c = np.unique(EVENTS_TR.time.values, return_counts=True)
u_t = np.argmax(c) # Unique time position to plot
Plot_Map_Z_Events_Time(
EVENTS_TR, u_t, xy_xb,
bathy_bw_rp, dem,
extent = ext_island_utm,
var = 'Z*',
)
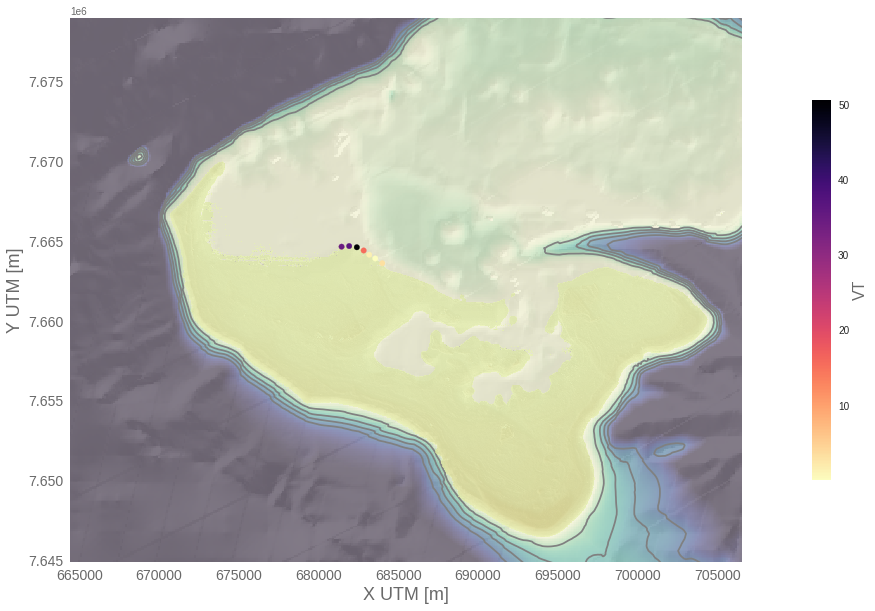
Plot_Map_Z_Events_Time(
EVENTS_TR, u_t, xy_xb,
bathy_bw_rp, dem,
extent = ext_island_utm,
var = 'VT',
)
Plot_Map_Z_Events_Time(
EVENTS_TR, u_t, xy_xb,
bathy_bw_rp, dem,
extent = ext_island_utm,
var = 'duration',
)

Flooding Maps#
X_transects = 5 #Asses times when then number of flooded transects are over this threshold
a = np.vstack([transects[:,0], transects[:,1], np.full(np.shape(transects[:,0]), 0)]).T
df= pd.DataFrame(a , columns = ['x', 'y', 'depth']) # 0  depth in contour points

if site_g == 'Samoa':
    df['x'] = round(df.x, 1)
    df['y'] = round(df.y, 1)

df = df.groupby(['x', 'y']).max().reset_index()
FLOOD_TIME = Get_Flood_Maps(EVENTS_TR, p_lf_cases, df,moved_y_t, moved_mesh, X_transects=X_transects, site=site)
Pos: 0/0
d_min = 0.001
FLOOD_TIME['depth'] = (
    ('x', 'y', 'time'),
    np.where(FLOOD_TIME['depth'].values<d_min, np.nan, FLOOD_TIME['depth'].values),
)
# store flooding maps
FLOOD_TIME.to_netcdf(p_flooding_maps)
Maximum
FLOOD_TIME
<xarray.Dataset>
Dimensions:  (time: 1, x: 6744, y: 7784)
Coordinates:
  * x        (x) float64 6.707e+05 6.707e+05 6.707e+05 ... 7.044e+05 7.044e+05
  * y        (y) float64 7.646e+06 7.646e+06 7.646e+06 ... 7.67e+06 7.67e+06
  * time     (time) datetime64[ns] 2018-05-27T18:00:00
Data variables:
depth (x, y, time) float64 nan nan nan nan nan ... nan nan nan nan nan- time: 1
- x: 6744
- y: 7784
- x(x)float646.707e+05 6.707e+05 ... 7.044e+05
array([670704.596, 670709.596, 670714.596, ..., 704409.596, 704414.596, 704419.596]) - y(y)float647.646e+06 7.646e+06 ... 7.67e+06
array([7646455.4912, 7646455.4912, 7646460.4912, ..., 7670015.4912, 7670020.4912, 7670020.4912]) - time(time)datetime64[ns]2018-05-27T18:00:00
array(['2018-05-27T18:00:00.000000000'], dtype='datetime64[ns]')
- depth(x, y, time)float64nan nan nan nan ... nan nan nan nan
array([[[nan],
        [nan],
        [nan],
        ...,
        [nan],
        [nan],
        [nan]],

       [[nan],
        [nan],
        [nan],
        ...,
        [nan],
        [nan],
        [nan]],

       [[nan],
        [nan],
        [nan],
        ...,
...
        ...,
        [nan],
        [nan],
        [nan]],

       [[nan],
        [nan],
        [nan],
        ...,
        [nan],
        [nan],
        [nan]],

       [[nan],
        [nan],
        [nan],
        ...,
        [nan],
        [nan],
        [nan]]])
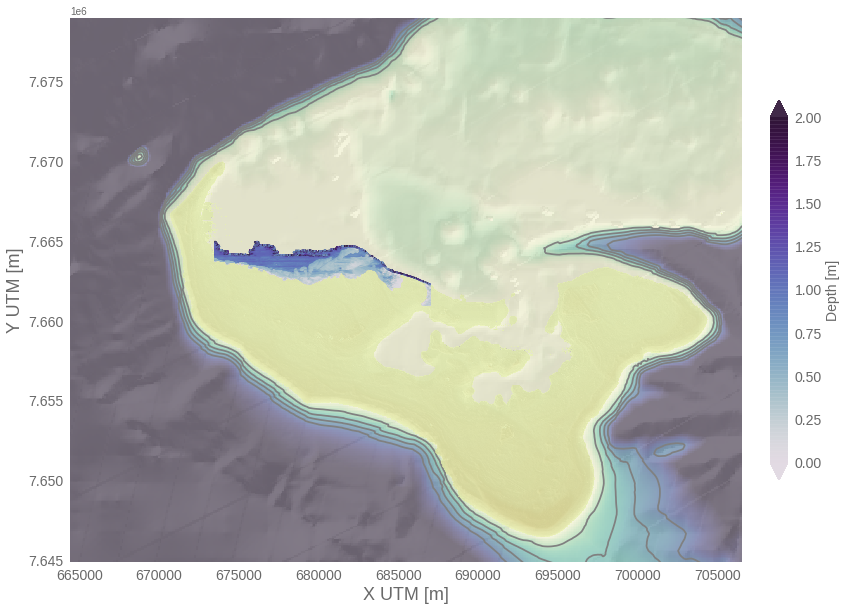
t='max' #time position / 'max'

Plot_Flooding_Maps(FLOOD_TIME, bathy_bw_rp, dem, df, ext_island_utm, t = t, plot_points = True)
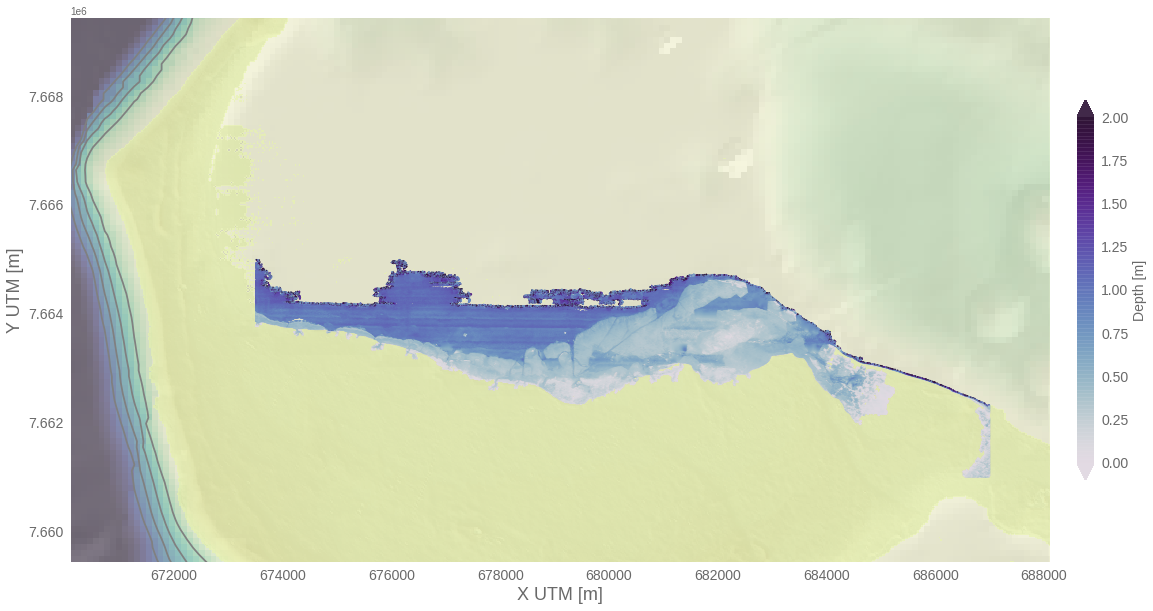
Area surrounding the most flooded point
ids = np.unravel_index(np.nanargmax(FLOOD_TIME.depth.values), FLOOD_TIME.depth.values.shape)
xmax, ymax = FLOOD_TIME.x.values[ids[0]], FLOOD_TIME.y.values[ids[1]]
a_x, a_y = 9000, 5000
extent = [xmax-a_x, xmax+a_x, ymax-a_y, ymax+a_y]

t='max' #time position / 'max'

Plot_Flooding_Maps(
        FLOOD_TIME.isel(time=np.arange(ids[2]-1, ids[2]+1)),
        bathy_bw_rp, dem, site, extent,
        t = t, plot_points = True
    )
print("execution end: {0}".format(datetime.today().strftime('%Y-%m-%d %H:%M:%S')))
execution end: 2022-09-13 20:35:37