Swell Inundation: Waves
Contents
Swell Inundation: Waves#
from datetime import datetime

print("execution start: {0}".format(datetime.today().strftime('%Y-%m-%d %H:%M:%S')))
execution start: 2022-09-13 19:40:10
# common
import os
import os.path as op
import sys
import time

# pip
import xarray as xr
import numpy as np
import pandas as pd
import matplotlib.pyplot as plt
from IPython.core.display import HTML

# bluemath
sys.path.insert(0, op.join(op.abspath(''), '..', '..'))
sys.path.insert(0, op.join(op.abspath(''), '..'))

from bluemath.binwaves.reconstruction import get_hindcast_snapshot
from bluemath.binwaves.forecast import reconstruct_forecast_station, reconstruct_forecast_partitions
from bluemath.astronomical_tide import calculate_AT_TPXO9v4


from bluemath.superpoint.spectra import stations_superposition
from bluemath.superpoint.plotting.spectra import Plot_spectrum

from bluemath.plotting.forecast import demo_spec_waves_forecast, animate_spec_waves_forecast
from bluemath.plotting.common import load_coast

# operational utils
from operational.util import clean_forecast_folder, read_config_args
from matplotlib import gridspec
import cartopy.crs as ccrs
import cartopy
plt.style.use('seaborn')
# hide warnings
import warnings
warnings.filterwarnings('ignore')
# HTML recipe to center notebook plots
HTML("""
<style>
.output_png {
    display: table-cell;
    text-align: center;
    vertical-align: middle;
}
</style>
""")

# matplotlib animatiom embed limit
import matplotlib
matplotlib.rcParams['animation.embed_limit'] = 2**128
Methodology: Reforecast#
p_data = r'/media/administrador/HD2/SamoaTonga/data'
p_db = r'/media/administrador/HD1/DATABASES'

# site = 'Tongatapu'  # Samoa / Tongatapu

# (optional) get site from config file
nb_args = read_config_args(op.abspath(''), '05a_swell_inundation_forecast_waves')
site = nb_args['site']

print('Study site: {0}'.format(site))
Study site: Tongatapu
Database#
p_site = op.join(p_data, site)

# stations
p_stat = op.join(p_site, 'stations')

# deliverable folder
p_deliv = op.join(p_site, 'd05_swell_inundation_forecast')

# swan simulation
p_swan = op.join(p_deliv, 'swan')

name = 'binwaves'
p_swan_output = op.join(p_swan, name, 'out_main_binwaves.nc')

# astronomical tide
# model
model_directory = op.join(p_db, 'TPX09_atlas_v4')

# reconstruction propagation coefficients
p_site_rec = op.join(p_deliv, 'reconstruction')
p_kp_coeffs = op.join(p_site_rec, 'kp_grid')
p_reco_hnd = op.join(p_site_rec, 'hindcast')
p_reco_ref = op.join(p_site_rec, 'reforecast')

if not op.isdir(p_reco_ref):
    os.makedirs(p_reco_ref)
# site related parameteres
if site == "Samoa":
    # region
    node_lon, node_lat = -172.07 + 360, -13.76
    ev_date = ['2015-01-22', '2015-01-24']
    size = 1.5

    # swan simulation output
    _area_extraction = [-172.85+360, -171.38+360, -14.09, -13.41]
    _resample_factor = 6 # points resample factor (2, 4, 6, 8, 10 ...)


elif site == 'Tongatapu':
    # region
    node_lon, node_lat = -175.07 + 360, -21.22
    point_peak = [-175.174492+360, -21.128513]
    size = 1
    # ev_date = ['1998-03-06', '1998-03-09']
    ev_date = ['2018-05-26', '2018-05-28']

    # swan simulation output
    _area_extraction = [184.5, 185.3, -21.62, -20.97]
    _resample_factor = 6 # points resample factor (2, 4, 6, 8, 10 ...)

region = [node_lat, node_lon, size, size]  # [lat, lon, dlat, dlon]
Load wave point close to select peaks#
out_sim_swan = xr.open_dataset(p_swan_output)
# cut area
out_sim = out_sim_swan.sel(
    lon = slice(_area_extraction[0], _area_extraction[1]),
    lat = slice(_area_extraction[2], _area_extraction[3]),
)

# resample extraction points
out_sim = out_sim.isel(
    lon = np.arange(0, len(out_sim.lon), _resample_factor),
    lat = np.arange(0, len(out_sim.lat), _resample_factor),
)
Hindcast Waves#
dates = np.array(pd.date_range(start=ev_date[0],end=ev_date[1], freq='3h')).astype('datetime64')
W_S = []
for d in dates:
    W_S.append(get_hindcast_snapshot(p_reco_hnd, out_sim, d))
W_S = xr.concat(W_S, dim='time')
W_S['time'] = dates
AT#
# domain coordinates
lon_tide_domain = [_area_extraction[0]-0.2, _area_extraction[1]+0.2]
lat_tide_domain = [ _area_extraction[2]-0.2,  _area_extraction[3]+0.2]

ds_tide = calculate_AT_TPXO9v4(
    model_directory, lon_tide_domain, lat_tide_domain,
    W_S.time.values[0], W_S.time.values[-1] + np.timedelta64(1, 'h'),
)

ds_tide['lon'] = ds_tide['lon'] + 360

tide = (
    (ds_tide.interpolate_na(dim=('lon'), method='nearest').tide.values) + \
    (ds_tide.interpolate_na(dim=('lat'), method='nearest').tide.values)
)/2

ds_tide['tide'] = (('lat', 'lon', 'time'), tide)
IB#
try:

    press = xr.open_dataset(op.join(p_db, 'CFSR-prmsl', 'prmsl.cdas1.'+
                                    str(W_S.time.dt.year[0].values)+
                                    str(W_S.time.dt.month[0].values).zfill(2) + '.grb2.nc')).sel(time=W_S.time.values)
except:
    press = xr.open_dataset(op.join(p_db, 'CFSR-prmsl', 'prmsl.gdas.'+
                                    str(W_S.time.dt.year[0].values)+
                                    str(W_S.time.dt.month[0].values).zfill(2) + '.grb2.nc')).sel(time=W_S.time.values)

press = press.rename({'PRMSL_L101':'p'})
press['IB'] = (('time', 'lat', 'lon'), (press.p.values/100-1013.25)*-1/100)
TWL#
W_S['AT'] = ds_tide.interp(lon = W_S.lon.values, lat = W_S.lat.values).tide
W_S['IB'] = press.IB.interp(lon = W_S.lon.values, lat = W_S.lat.values)

W_S = W_S.transpose('time', 'lon', 'lat')
W_S['TWL'] = (('time', 'lon', 'lat'), W_S.AT.values + W_S.IB.values + 0.3*W_S.Hs.values)
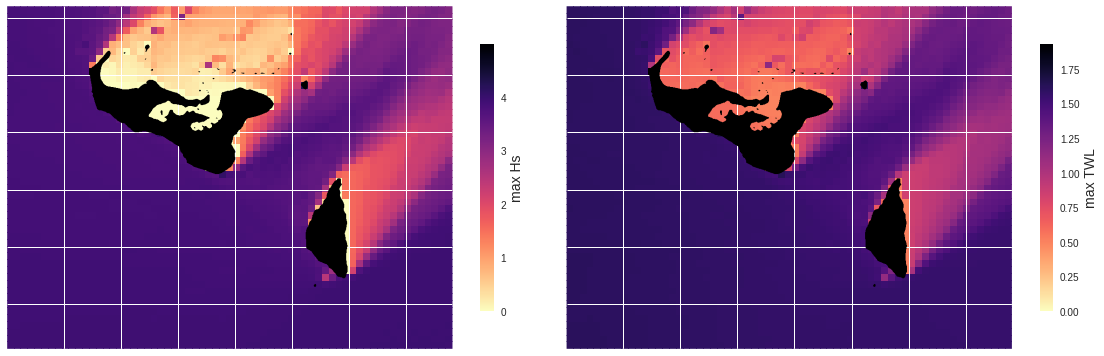
fig = plt.figure(figsize=[20, 7])
gs = gridspec.GridSpec(1, 2, hspace = 0.005, wspace = 0.005)

ax = fig.add_subplot(gs[0], projection = ccrs.PlateCarree(central_longitude=180))
ax.add_feature(load_coast(), facecolor = 'black', edgecolor = None, alpha = 1, linewidth = 1.5, zorder = 5)
ax.gridlines()
im = ax.pcolor(W_S.lon.values, W_S.lat.values, W_S.max(dim='time').Hs.values.T, vmin=0, cmap='magma_r', transform = ccrs.PlateCarree())
plt.colorbar(im, ax=ax, shrink = .7).set_label('max Hs', fontsize = 14)

ax = fig.add_subplot(gs[1], projection = ccrs.PlateCarree(central_longitude=180))
ax.add_feature(load_coast(), facecolor = 'black', edgecolor = None, alpha = 1, linewidth = 1.5, zorder = 5)
ax.gridlines()
im = ax.pcolor(W_S.lon.values, W_S.lat.values, W_S.max(dim='time').TWL.values.T, vmin=0, cmap='magma_r', transform = ccrs.PlateCarree())
plt.colorbar(im, ax=ax, shrink = .7).set_label('max TWL', fontsize = 14)
W_S.to_netcdf(op.join(p_reco_ref, 'Waves_Levels_{0}_{1}.nc'.format(ev_date[0], ev_date[1])))