From Offshore to Coastline
Contents
From Offshore to Coastline#
from datetime import datetime

print("execution start: {0}".format(datetime.today().strftime('%Y-%m-%d %H:%M:%S')))
execution start: 2022-09-13 20:01:36
Methodology
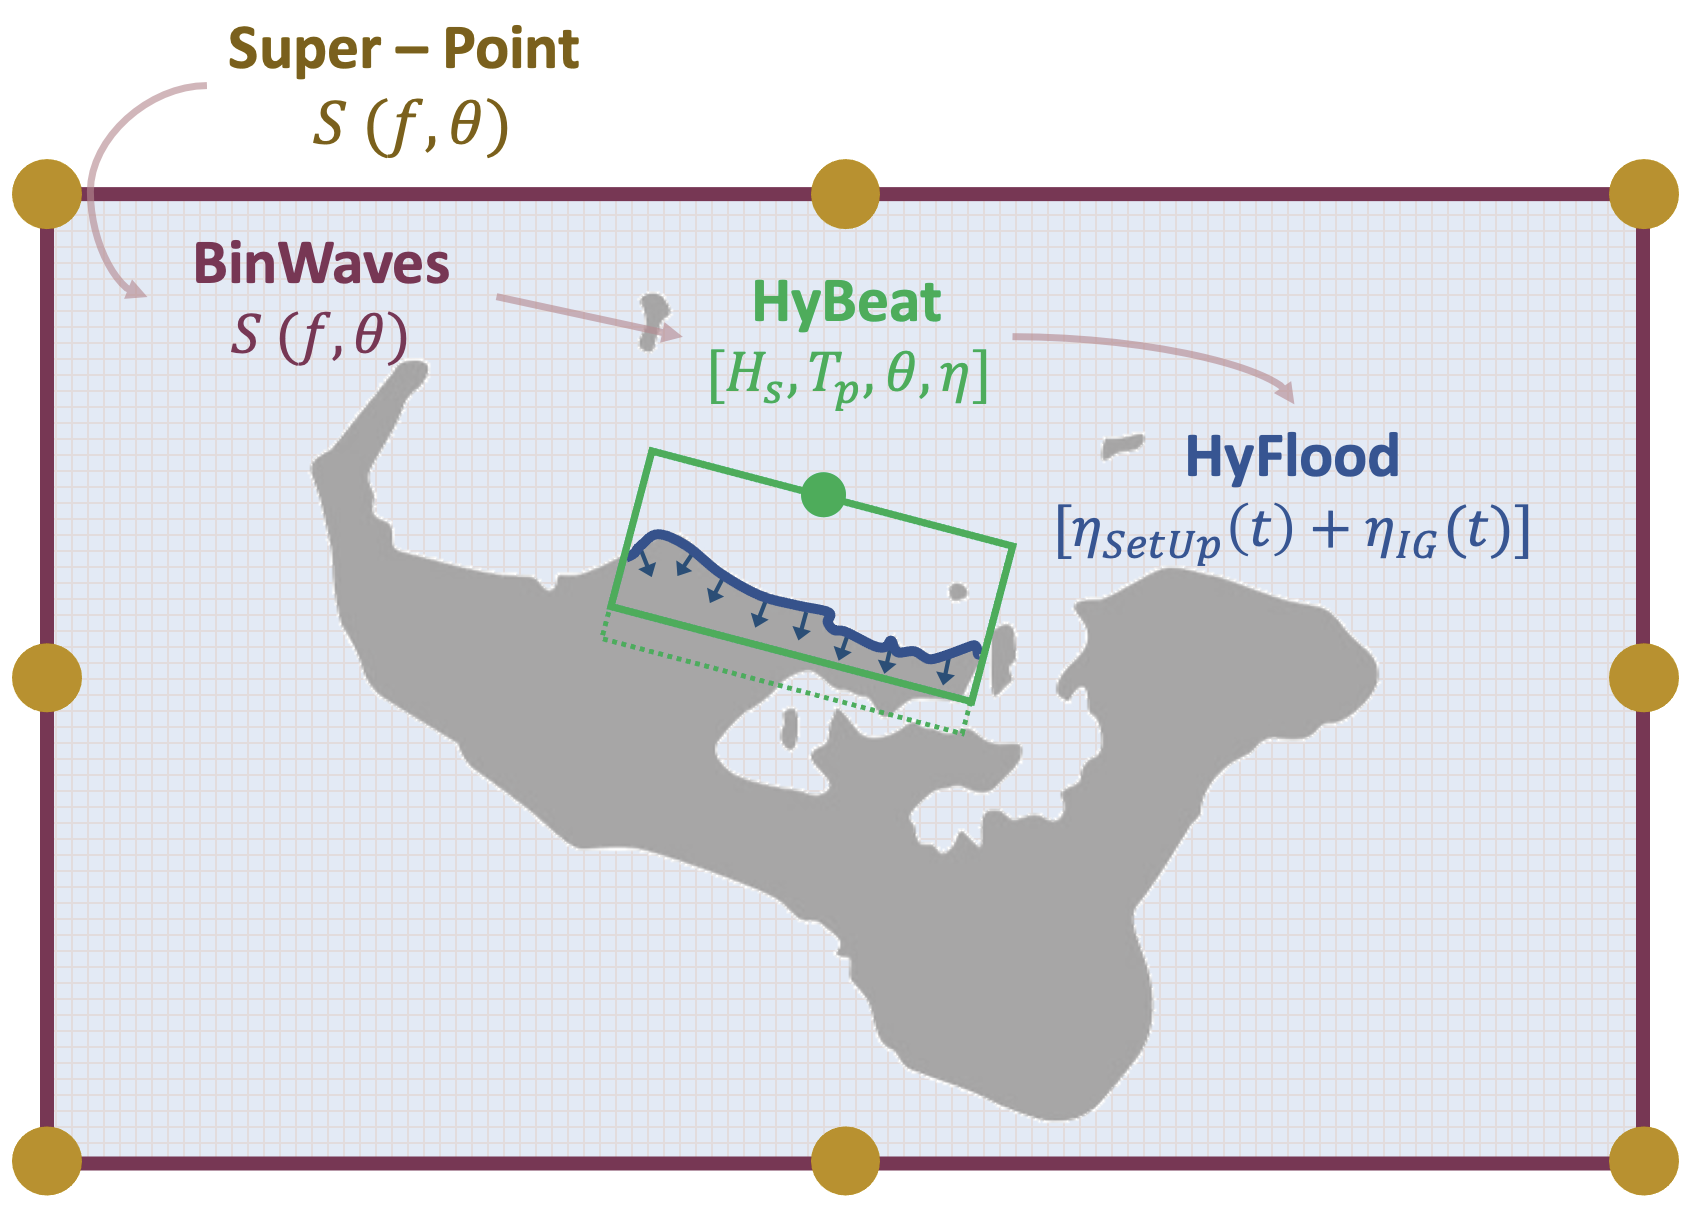
For the development of flooding maps, we will couple two methodologies called HyBeat and HyFlood.
HyBeat is a metamodel based on XBeach simulations, that allows to obtain the mean setup and the infragravity wave at a very high resolution (~ 5-20m) at the coast.
Hyflood is a metamodel based on Lisflood-FP runs, that based on the evolution of the sea level at the coast, allows to reconstruct flooding extents.
The coupling of both metamodels allows to take the wave and surge information at a ~30m depth and transform it to flooding extents in a very efficient way.
HyBeat
In this notebook we are going to focus on extracting the information from BinWaves and Greensurge at the points that will force the HyBeat - XBeach metamodel and extract the setup and infragravity components at the coastline to have the information needed to run HyFlood.
# common
import sys
import os
import os.path as op
import glob

# pip
import numpy as np
import pandas as pd
import pickle as pkl
import xarray as xr

import matplotlib
import matplotlib.pyplot as plt
from matplotlib.colors import LinearSegmentedColormap
from matplotlib import gridspec
import cartopy
import cartopy.crs as ccrs
import cmocean
import earthpy.spatial as es

import xarray
import rioxarray
from pyproj import CRS

from sklearn import preprocessing
from sklearn.neighbors import KNeighborsRegressor

# bluemath
sys.path.insert(0, op.join(op.abspath(''), '..', '..'))
sys.path.insert(0, op.join(op.abspath(''), '..'))

from bluemath.astronomical_tide import calculate_AT_TPXO9v4

# reconstruction
from bluemath.rbf import RBF_Reconstruction
from bluemath.LHS import RBF_var_reconstruct
from bluemath.flood_coastal import reproject, Remove_Project_Wrong_Values, Add_Bathy_Waves, Add_Bathy_Tesela, Plot_SS_DEM_Bathymetry, \
Obtain_Waves_XBeach_Coords, Plot_BinWaves_Locations_30, plot_vars, XBeach_RBF_Reconstruction, Plot_SetUp_Metamodel, \
Background_Plot, Get_Levels_LF_Transect_Coordinates

# operational utils
from operational.util import read_config_args
# hide warnings
import warnings
warnings.filterwarnings('ignore')
Forecast Parameteres#
p_data = r'/media/administrador/HD2/SamoaTonga/data'
p_db = r'/media/administrador/HD1/DATABASES'
p_resources = op.join(op.abspath(''), '..', '..', 'resources')

# site = 'Tongatapu'  # Upolu / Savaii / Tongatapu

# (optional) get site from config file
nb_args = read_config_args(op.abspath(''), '05c_swell_inundation_forecast_flooding_inputs')
site = nb_args['site']

print('Study site: {0}'.format(site))
Study site: Tongatapu
# site related parameteres
if site == 'Tongatapu':

    # ev_date = ['1998-03-06', '1998-03-09']
    ev_date = ['2018-05-26', '2018-05-28']

    site_g = 'Tongatapu'
    mesh_id = 'TX'
    b_x_correction = 0

    ext_island_ll = [-175.396+360, -174.972621+360, -21.295, -21.0508] #Tongatapu
    ext_island_utm = [664446, 706583, 7644909, 7679000] #Tongatapu
    ext_capital_utm = [684263, 692910, 7658223, 7663225] #Nukualofa

    gs_name = 'GFD_Tonga_T80_W40_D15_24h_CDdefault'

    projection = 'EPSG:32701'

    ext_xb_mesh = [660000, 716000, 7639000, 7675000]

elif site == 'Upolu':

    ev_date = ['2015-01-22', '2015-01-24']

    site_g = 'Samoa'
    mesh_id = 'UX'
    b_x_correction = 0.02

    ext_island_ll = [-172.164743+360, -171.367548+360, -14.071473, -13.736878] #Upolu
    ext_island_utm = [376323, 459801, 8441401, 8483467] #Upolu
    ext_capital_utm = [409725, 425384 , 8469398, 8475126]

    gs_name = 'GFD_Samoa_T84_W40_D15_24h_CDdefault'

    projection = 'EPSG:32702'

    ext_xb_mesh=[]

elif site == 'Savaii':

    ev_date = ['2015-01-22', '2015-01-24']

    site_g = 'Samoa'
    mesh_id = 'SX'
    b_x_correction = 0.02

    ext_island_ll = [-172.897+360, -172.165+360, -13.91, -13.3798] #Savaii
    ext_island_utm = [296502, 376858, 8471406, 8517818] #Savaii
    ext_capital_utm = [341875, 355041 , 8508096, 8516201]

    gs_name = 'GFD_Samoa_T84_W40_D15_24h_CDdefault'
    projection = 'EPSG:32702'
    ext_xb_mesh=[]
#
from IPython.display import Image
Image(filename = op.join(p_resources, 'images', 'sketch_hybeat_hyflood_'+site.lower()+'.png'), width=700)
Database#
# database
p_site = op.join(p_data, site_g)
# Model paths

# XBeach
p_xb = op.join(p_db, 'XBeach', 'Final_Results', site)
p_xb_mesh = op.join(p_db, 'XBeach', 'Final_Results', site, 'PCA_results')#, 'Meshes')

p_xb_bcp = op.join(p_xb, site + '_meshes_BCpoints.txt')
p_xb_ori = op.join(p_xb, site + '_meshes_Orientation.txt')
p_lf_bc = op.join(p_xb, 'shore_LFpoints_XBmeshes.xyz')

# BinWaves
p_bathy_bw = op.join(p_data, site_g, 'bathymetry', site_g.lower() + '_smooth.nc')

# Lisflood
p_lf_tr = op.join(p_db, 'Lisflood_Coastal', site, 'Shorelines', 'shore_'+ site.lower() +'_transects.pkl')
p_dem = op.join(p_db, 'Lisflood_Coastal', site, site + '_5m_dem.nc')
p_lhs_lf = op.join(p_db, 'Lisflood_Coastal', 'cases50_IG.nc')
p_deliv = op.join(p_site, 'd05_swell_inundation_forecast')
p_site_rec = op.join(p_deliv, 'reconstruction')
p_reco_ref = op.join(p_site_rec, 'reforecast')

p_input_w_l = op.join(p_reco_ref, 'Waves_Levels_{0}_{1}.nc'.format(ev_date[0], ev_date[1]))
Forecast Output Folder#
date = 'reforecast_{0}_{1}'.format(ev_date[0], ev_date[1])
# TC Wave and Level Forecast paths
p_forecast = op.join(p_site, 'forecast', '05_swell_inundation_system')
# forecast folder
p_fore_date = op.join(p_forecast, date)
print('forecast date code: {0}'.format(date))

# prepare forecast subfolders for this date
p_fore_near = op.join(p_fore_date, 'nearshore')
p_fore_waveslevel = op.join(p_fore_near, 'forecast_waves_level_twl.nc')
p_output = op.join(p_fore_near, 'flooding_{0}'.format(site))

# output files
p_out_xb_wl = op.join(p_output, 'Waves_and_Levels_XBPoints.nc')
p_out_xb_allvar = op.join(p_output, 'ALL_variables_XBeach_points.nc')
p_out_xb_lfin = op.join(p_output, 'Inputs_LisFlood.nc')

if not op.isdir(p_output):
    os.makedirs(p_output)
forecast date code: reforecast_2018-05-26_2018-05-28
## Load and preprocess database
XBeach boundary points
# Xbeach boundary points
coords = pd.read_csv(
    p_xb_bcp,
    delimiter = '   ',
    names = ['mesh', 'x', 'y'],
).to_xarray()

xb_meshes = range(len(coords.index))

xb_or = pd.read_csv(
    p_xb_ori,
    delimiter = '   ',
    names = ['mesh', 'orientation'],
).to_xarray()


# fix orientation for Tongatapu mesh
if site == 'Tongatapu':
    ori = xb_or.orientation.values
    ori[0] = 0
    xb_or['orientation'] = (('index'),ori)
Lisflood Transects
# Lisflood Transects
resample = 5  # just for plotting
dem = xr.open_dataset(p_dem).isel(x=slice(None, None, resample), y=slice(None, None, resample))
dem['z'] = (('y','x'),np.where(dem.z.values<0.1, np.nan, dem.z.values))

# Coast + transects
transects = pkl.load(open(p_lf_tr, 'rb'))
XBeach Boundary Conditions#
Waves and Storm Surge
Waves#
Bathymetry from BinWaves
# Bathymetry
bathy_bw = xr.open_dataset(p_bathy_bw)
bathy_bw['x'] = bathy_bw['x'] + b_x_correction
waves = xr.open_dataset(p_input_w_l)
waves['sl'] = (('time', 'lon', 'lat'), waves.AT.values + waves.IB.values)
waves = waves[['Hs', 'Tp', 'Dir', 'sl']].rename({'Dir':'Dp'})
waves = Add_Bathy_Waves(waves, bathy_bw, b_x_correction, ext_island_ll)

waves_rep = Remove_Project_Wrong_Values(reproject(waves,  end = projection))

ext_bati = [waves_rep.x.values.min(), waves_rep.x.values.max(), waves_rep.y.values.min(), waves_rep.y.values.max()]
t_ini, t_end = waves_rep.time.values[0], waves_rep.time.values[-1]
XBeach Set-Up Reconstruction#
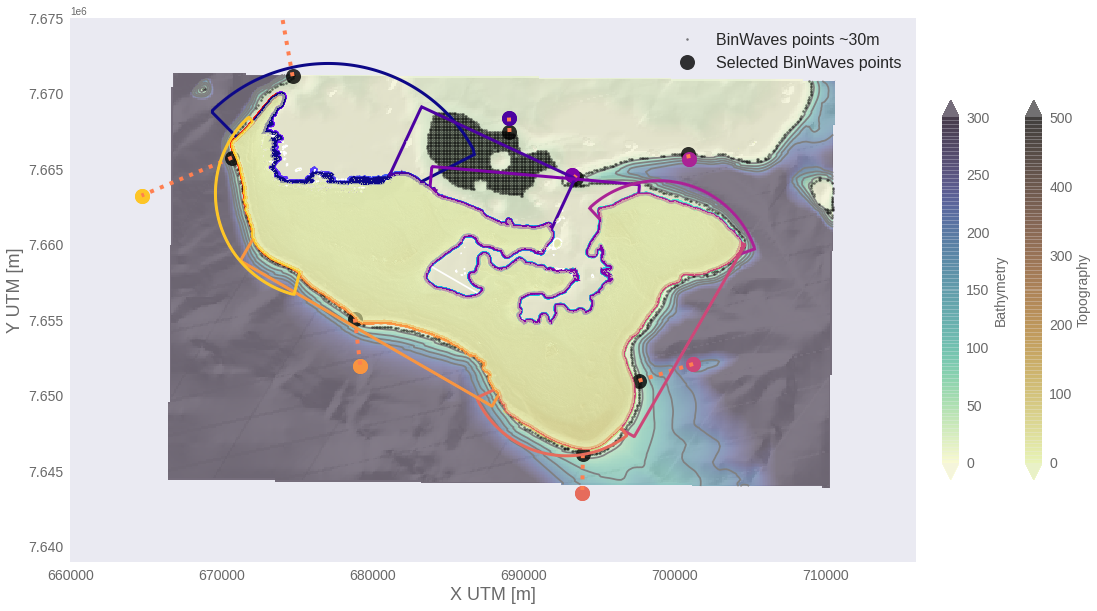
Calculate which point from BinWaves is used as the boundary condition of XBeach.
The point needs to be in a depth close to 30m
Wave Conditions#
W = Obtain_Waves_XBeach_Coords(waves_rep, xb_meshes, coords, mesh_id, lims = [25,35])
if not ext_xb_mesh:
    ext_xb_mesh = ext_bati

Plot_BinWaves_Locations_30(
    W, waves_rep, dem,
    ext_xb_mesh, p_xb_mesh,
    coords, xb_meshes, transects,
    site = site,
    mksize = 5,
)
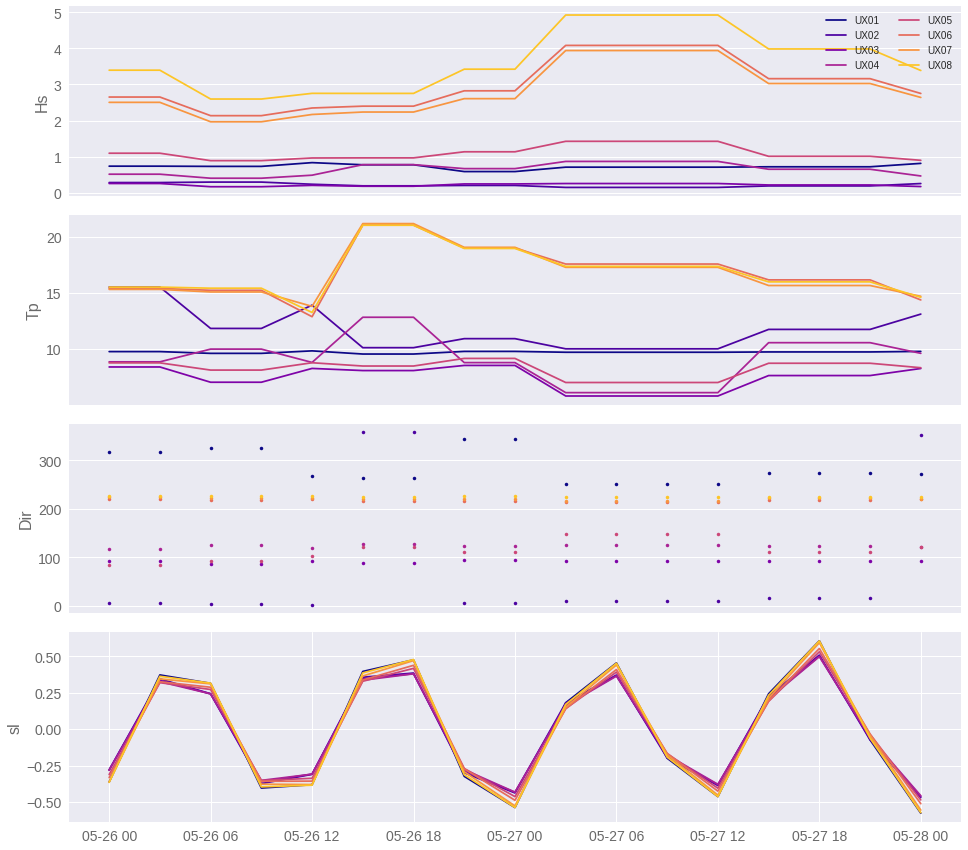
Select Common Dates from SS and Waves
W.to_netcdf(p_out_xb_wl)
vars_plot = ['Hs', 'Tp', 'Dir', 'sl']
plot_vars(W.rename({'Dp':'Dir'}), vars_plot, xb_meshes)
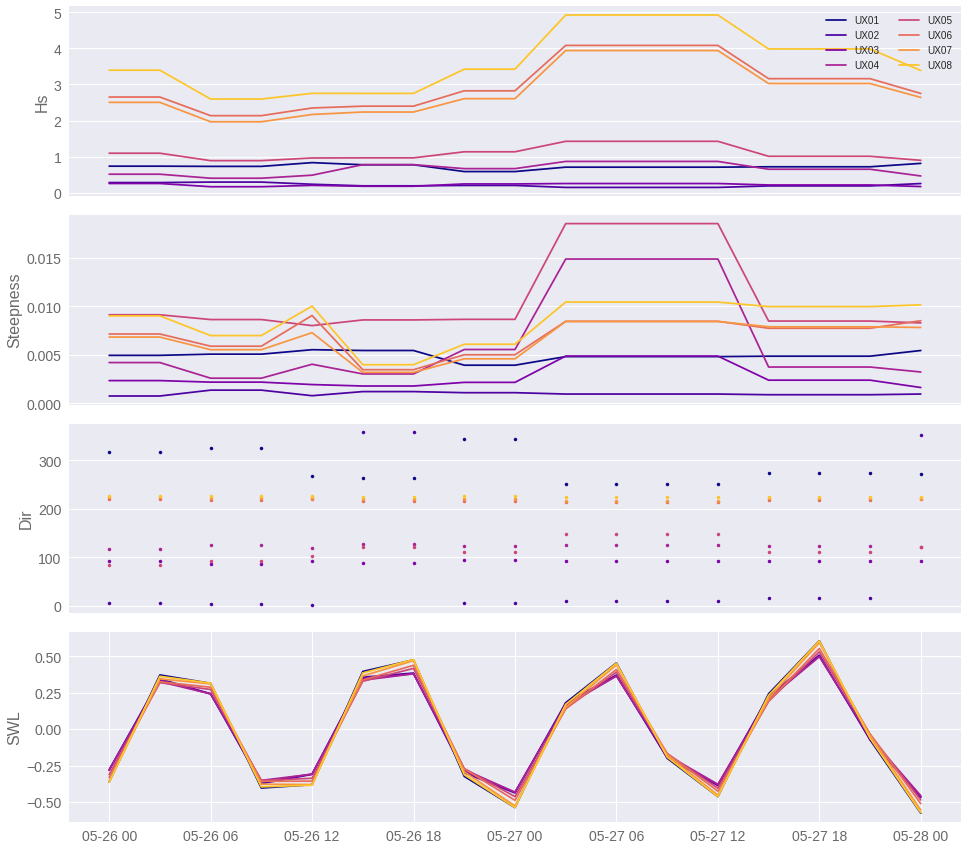
Subset for Reconstruction
ALL = W.copy()
ALL['SWL'] = (('xbmesh', 'time'), ALL.sl.values)

Steepness = 2*np.pi*(ALL.Hs.values)/(9.8*(ALL.Tp.values)**2)
ALL['Steepness'] = (('xbmesh', 'time'), Steepness)

ALL = ALL.rename({'Dp':'Dir'})

if op.isfile(p_out_xb_allvar):
    os.remove(p_out_xb_allvar)

ALL.to_netcdf(p_out_xb_allvar)
vars_plot = ['Hs', 'Steepness', 'Dir', 'SWL']
plot_vars(ALL, vars_plot, xb_meshes)
RBF Reconstruction in transect points
vars_mda = ['Hs','Steepness','Dir','SWL']

ix_scalar_subset = [0,1,3]
ix_directional_subset = [2]

vars_rec = ['zs_mean', 'zs_var']
ix_directional_target = []
Reconstruction
OUT = XBeach_RBF_Reconstruction(
    ALL, xb_meshes,
    p_xb, p_xb_mesh,
    xb_or, p_output,
    ncases = 100,
    site = site,
)
TX01
Reconstructing variable: zs_mean
Reconstructing variable: zs_var
TX02
Reconstructing variable: zs_mean
Reconstructing variable: zs_var
TX03
Reconstructing variable: zs_mean
Reconstructing variable: zs_var
TX04
Reconstructing variable: zs_mean
Reconstructing variable: zs_var
TX05
Reconstructing variable: zs_mean
Reconstructing variable: zs_var
TX06
Reconstructing variable: zs_mean
Reconstructing variable: zs_var
TX07
Reconstructing variable: zs_mean
Reconstructing variable: zs_var
TX08
Reconstructing variable: zs_mean
Reconstructing variable: zs_var
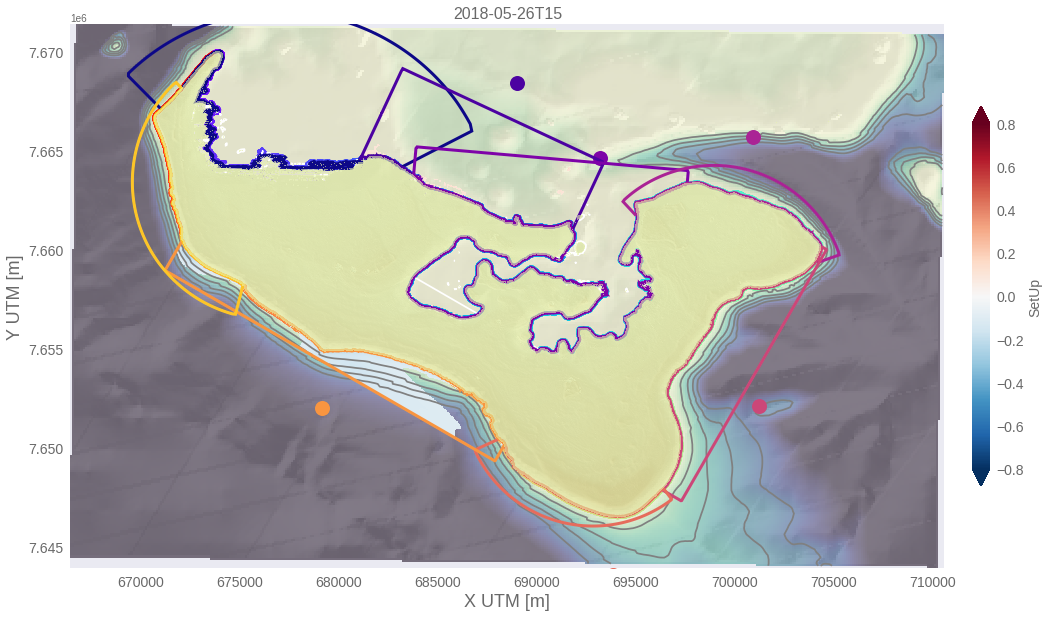
SetUp#
Time
t = 5#np.argmax(OUT[0].Hs.values)
time = OUT[0].isel(time=t).time.values
Plot_SetUp_Metamodel(
    OUT, waves_rep,
    dem, ext_bati, p_xb_mesh,
    coords, xb_meshes,
    transects = transects,
    time = time,
    var = 'zs_mean',
    maxmin = 0.8,
    site = site,
)
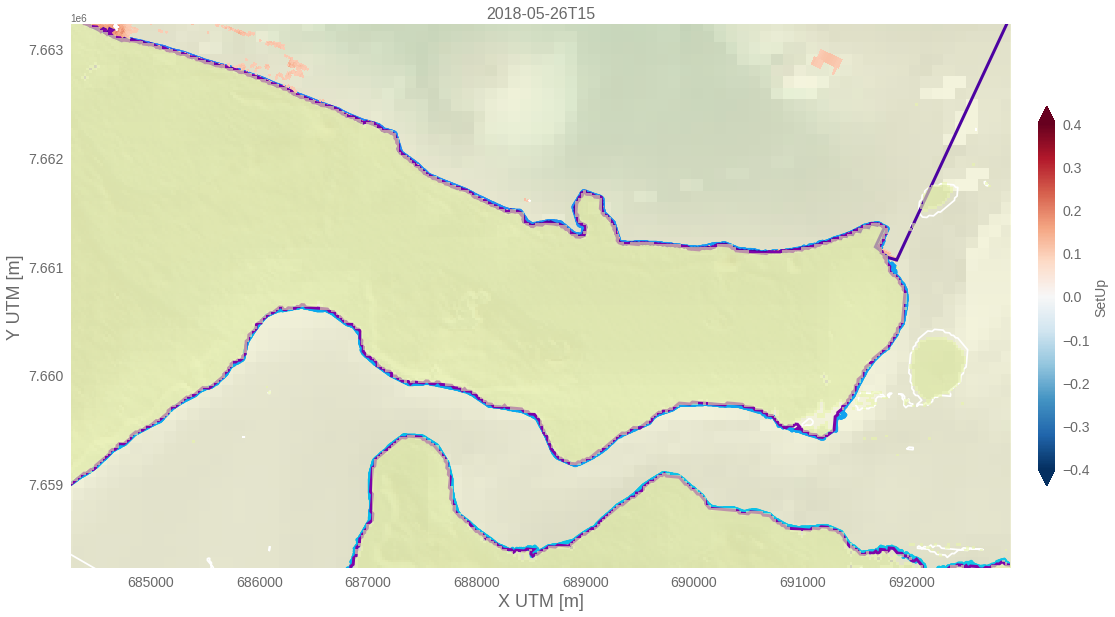
Plot_SetUp_Metamodel(
    OUT, waves_rep, dem,
    ext_capital_utm, p_xb_mesh,
    coords, xb_meshes,
    transects = transects,
    time = time,
    var = 'zs_mean',
    maxmin = 0.4,
    site = site,
)
Lisflood Boundary Conditions#
xy_xb = pd.read_csv(
    p_lf_bc,
    delimiter = ' ',
    names = ['x', 'y', 'xbmesh', 'lf_tr'],
).to_xarray()

xy_xb['lf_tr'] = (('index'),transects[:,2])

_, i_tx = np.unique(np.column_stack([xy_xb.x.values, xy_xb.y.values]), axis=0, return_index = True)
xy_xb = xy_xb.isel(index = i_tx)
xy_xb = xy_xb.isel(index=np.argsort(xy_xb.lf_tr.values))
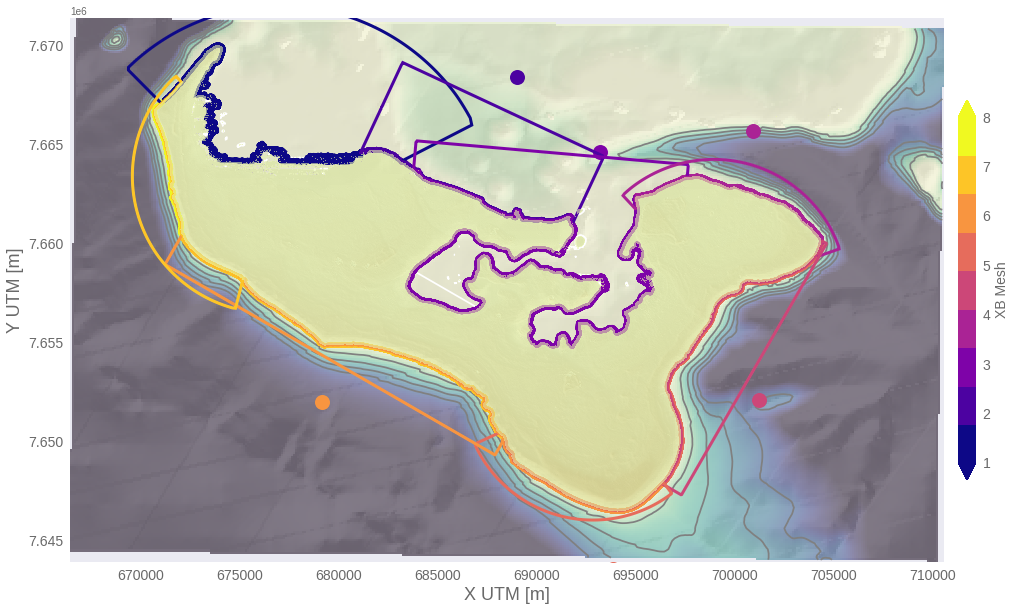
Xbeach mesh for each part of the coast
cmap = matplotlib.cm.get_cmap('plasma')
colors_xb = cmap(np.linspace(0,1,len(xb_meshes)+1))

ax = Background_Plot(
    bathy = waves_rep,
    dem = dem,
    extent = ext_bati,
    p_xb = p_xb_mesh,
    xb_coords = coords,
    xb_meshes = xb_meshes,
    transects=transects,
    cbars = False,
    site = site,
)

cmap_xb = LinearSegmentedColormap.from_list('cmap_xb', colors_xb, N=len(xb_meshes)+1)
im = ax.scatter(
    xy_xb.x.values, xy_xb.y.values,
    s = 20,
    c = xy_xb.xbmesh.values,
    cmap = cmap_xb,
    alpha = 1,
    zorder = 3,
    vmin = 1,
)

cb = plt.colorbar(im, shrink = .7, extend = 'both', pad=0.01)
cb.ax.tick_params(axis='both', which='major', labelsize=14, labelcolor = 'dimgray')
cb.set_label('XB Mesh', fontsize=14, color = 'dimgray')
XBeach SetUp
OUT_T = Get_Levels_LF_Transect_Coordinates(OUT, xy_xb)
Wind SetUp
OUT_T.to_netcdf(p_out_xb_lfin)
print("execution end: {0}".format(datetime.today().strftime('%Y-%m-%d %H:%M:%S')))
execution end: 2022-09-13 20:08:33