Seasonal TCs
Contents
Seasonal TCs#
from datetime import datetime

print("execution start: {0}".format(datetime.today().strftime('%Y-%m-%d %H:%M:%S')))
execution start: 2022-09-11 22:00:03
# common
import os
import os.path as op
import sys
import pickle as pk
import pickle5 as pk5

# pip
import numpy as np
import pandas as pd
import xarray as xr
from IPython.display import IFrame
import cfgrib
import requests

# bluemath
sys.path.insert(0, op.join(op.abspath(''), '..', '..'))
sys.path.insert(0, op.join(op.abspath(''), '..'))

from bluemath.ddviewer.downloader.forecast import webscan_noaa_ncei, download_noaa

from bluemath.seasonal_forecast_tcs.forecast import process_forecast_day
from bluemath.seasonal_forecast_tcs.plotting.forecast import variables_plot_forecast, plot_forecast_month, plot_seasonal_forecast

# operational utils
from operational.util import clean_forecast_folder, read_config_args
Warning: ecCodes 2.21.0 or higher is recommended. You are running version 2.16.0
# hide warnings
import warnings
warnings.filterwarnings('ignore')
Forecast parameteres#
p_data = r'/media/administrador/HD2/SamoaTonga/data'
p_db = r'/media/administrador/HD1/DATABASES'

#site = 'SamoaTonga'  # SamoaTonga

# (optional) get site from config file
nb_args = read_config_args(op.abspath(''), '04_seasonal_forecast_tcs')
site = nb_args['site']

print('Study site: {0}'.format(site))
Study site: SamoaTonga
# automated forecast date, updated up to 3/4 days before present
years, months, days, runs = webscan_noaa_ncei()
year, month, day, run = int(years[-1]), int(months[-1]), int(days[-1]), int(runs[-1])
print('last available date: {0}{1}{2}'.format(year, month, day))
last available date: 202297
# get available run (NOAA prmsl forecast run  [0, 6, 12, 18])
runs = [int(r) for r in runs]

# selected run to solve
run_sel = runs[0]
print('run: {0}'.format(run_sel))

# predictor parameters
lo_area = [160, 210]
la_area = [-30, 0]
lop1 = 160.25
lop2 = 211
lap1 = -0.25
lap2 = -32
delta = 2

# data download options
_load_local_cache = False
_clean = False

_clean_forecast_folder_days = 7  # days to keep after forecast folder cleaning
run: 0
Database#
p_site = op.join(p_data, site)

# deliverable
p_deliv = op.join(p_site, 'seasonal_forecast_tcs')

# IBTrACS database
p_ibtracs = op.join(p_data, 'IBTrACS.ALL.v04r00.nc')

# KMA model
p_kma = op.join(p_deliv, 'kma')
p_kma_model = op.join(p_deliv, 'kma', 'kma_index_okb.pkl')

# index predictor values
p_sst_mld_slp_calibration = op.join(p_deliv, 'sst_mld_slp_calibration.nc')

# mld of reference
p_mld = op.join(p_db, 'SeasonalForecast_TCs', 'CFS', 'ocnmld')
p_mld_1982 = op.join(p_mld, 'ocnmld.day.mean.1982.nc')
Forecast Output Folder#
p_forecast = op.join(p_site, 'forecast', '04_seasonal_tcs')

# forecast folder
date = '{0:04d}{1:02d}{2:02d}'.format(year, month, day)
p_fore_date = op.join(p_forecast, date)
print('forecast date code: {0}'.format(date))

# prepare forecast subfolders for this date
p_fore_dl_mld = op.join(p_fore_date, 'download', 'ocnmld')
p_fore_dl_sfc = op.join(p_fore_date, 'download', 'tmpsfc')

for p in [p_fore_date, p_fore_dl_mld, p_fore_dl_sfc]:
    if not op.isdir(p):
        os.makedirs(p)

# clean forecast folder
clean_forecast_folder(p_forecast, days=_clean_forecast_folder_days)
forecast date code: 20220907
deleted folder: /media/administrador/HD2/SamoaTonga/data/SamoaTonga/forecast/04_seasonal_tcs/20220820
# load needed data

df = pd.read_pickle(op.join(p_deliv, 'df_coordinates_pmin_sst_mld_2021.pkl'))
xs = xr.open_dataset(p_sst_mld_slp_calibration)
xds_kma =  xr.open_dataset(op.join(p_kma, 'xds_kma_index_vars.nc'))
xds_count_tcs_8 = xr.open_dataset(op.join(p_deliv, 'xds_count_tcs_8.nc'))
xds_count_tcs_8_964 = xr.open_dataset(op.join(p_deliv, 'xds_count_tcs_8_964.nc'))
xds_timeM = xr.open_dataset(op.join(p_deliv, 'xds_timeM.nc'))
xds_PCA = xr.open_dataset(op.join(p_deliv, 'xds_pca.nc'))
Download and process variables#
for cont, run in enumerate(runs):

    # download mld
    print('download ocnmld. run number {0}'.format(run))
    mld = download_noaa(
        'ocnmld',
        year, month, day, run,
        p_f = p_fore_dl_mld,
        load_local_cache=_load_local_cache, clean=_clean,
    )
    print('')

    p_mld_daily = op.join(p_fore_date, 'ocnmld.'+str(year)+'.'+str(month)+'.'+str(run)+'.daily.grb2.nc')
    mld.to_netcdf(p_mld_daily)

    # resample mld to daily
    mld = mld.drop({'time', 'level', 'valid_time'}).rename(
            {'step':'time', 'longitude':'lon', 'latitude':'lat'},
    )
    mld = mld.resample(time = '1d').mean()

    p_mld_day_mean = op.join(p_fore_date, str(year)+'.'+str(month) + '.mld_day_mean.' + str(cont+1) + '.nc')
    mld.to_netcdf(p_mld_day_mean)

    # download sst
    print('download tmpsfc. run number {0}'.format(run))
    sst = download_noaa(
        'tmpsfc',
        year, month, day, run,
        p_f = p_fore_dl_sfc,
        load_local_cache=_load_local_cache, clean=_clean,
    )
    print('')

    p_sst_daily = op.join(p_fore_date, 'tmpsfc.'+str(year)+'.'+str(month)+'.'+str(run)+'.daily.grb2.nc')
    sst.to_netcdf(p_sst_daily)

    # resample sst to daily
    sst = sst.drop({'time', 'surface', 'valid_time'}).rename(
        {'step':'time', 'longitude':'lon', 'latitude':'lat', 't':'sst'},
    )
    sst = sst.resample(time = '1d').mean()

    # interpolate to mld coordiantes
    sst = sst.interp(lat = mld.lat.values, lon = mld.lon.values)

    p_sst_day_mean = op.join(p_fore_date, str(year)+'.'+str(month) + '.sst_day_mean.' + str(cont+1) + '.nc')
    sst.to_netcdf(p_sst_day_mean)
download ocnmld. run number 0
Downloading forecast data from:
https://www.ncei.noaa.gov/data/climate-forecast-system/access/operational-9-month-forecast/time-series/2022/202209/20220907/2022090700/ocnmld.01.2022090700.daily.grb2
Storing local copy at:
/media/administrador/HD2/SamoaTonga/data/SamoaTonga/forecast/04_seasonal_tcs/20220907/download/ocnmld
download tmpsfc. run number 0
Downloading forecast data from:
https://www.ncei.noaa.gov/data/climate-forecast-system/access/operational-9-month-forecast/time-series/2022/202209/20220907/2022090700/tmpsfc.01.2022090700.daily.grb2
Storing local copy at:
/media/administrador/HD2/SamoaTonga/data/SamoaTonga/forecast/04_seasonal_tcs/20220907/download/tmpsfc
download ocnmld. run number 6
Downloading forecast data from:
https://www.ncei.noaa.gov/data/climate-forecast-system/access/operational-9-month-forecast/time-series/2022/202209/20220907/2022090706/ocnmld.01.2022090706.daily.grb2
Storing local copy at:
/media/administrador/HD2/SamoaTonga/data/SamoaTonga/forecast/04_seasonal_tcs/20220907/download/ocnmld
download tmpsfc. run number 6
Downloading forecast data from:
https://www.ncei.noaa.gov/data/climate-forecast-system/access/operational-9-month-forecast/time-series/2022/202209/20220907/2022090706/tmpsfc.01.2022090706.daily.grb2
Storing local copy at:
/media/administrador/HD2/SamoaTonga/data/SamoaTonga/forecast/04_seasonal_tcs/20220907/download/tmpsfc
download ocnmld. run number 12
Downloading forecast data from:
https://www.ncei.noaa.gov/data/climate-forecast-system/access/operational-9-month-forecast/time-series/2022/202209/20220907/2022090712/ocnmld.01.2022090712.daily.grb2
Storing local copy at:
/media/administrador/HD2/SamoaTonga/data/SamoaTonga/forecast/04_seasonal_tcs/20220907/download/ocnmld
download tmpsfc. run number 12
Downloading forecast data from:
https://www.ncei.noaa.gov/data/climate-forecast-system/access/operational-9-month-forecast/time-series/2022/202209/20220907/2022090712/tmpsfc.01.2022090712.daily.grb2
Storing local copy at:
/media/administrador/HD2/SamoaTonga/data/SamoaTonga/forecast/04_seasonal_tcs/20220907/download/tmpsfc
Processing forecast data#
Predictor data from a day is downloaded and preprocessed, and the statistical model is applied to compute the TCs forecast from this day to next 9 months.
# preprocess data and apply statistical model to compute next 9 months TCs
process_forecast_day(
    p_fore_date, p_kma_model, p_mld_1982,
    year, month, xds_PCA, xds_count_tcs_8, xds_count_tcs_8_964, xs, df,
    lop1, lop2, lap1, lap2, delta,
    runs = runs,
)
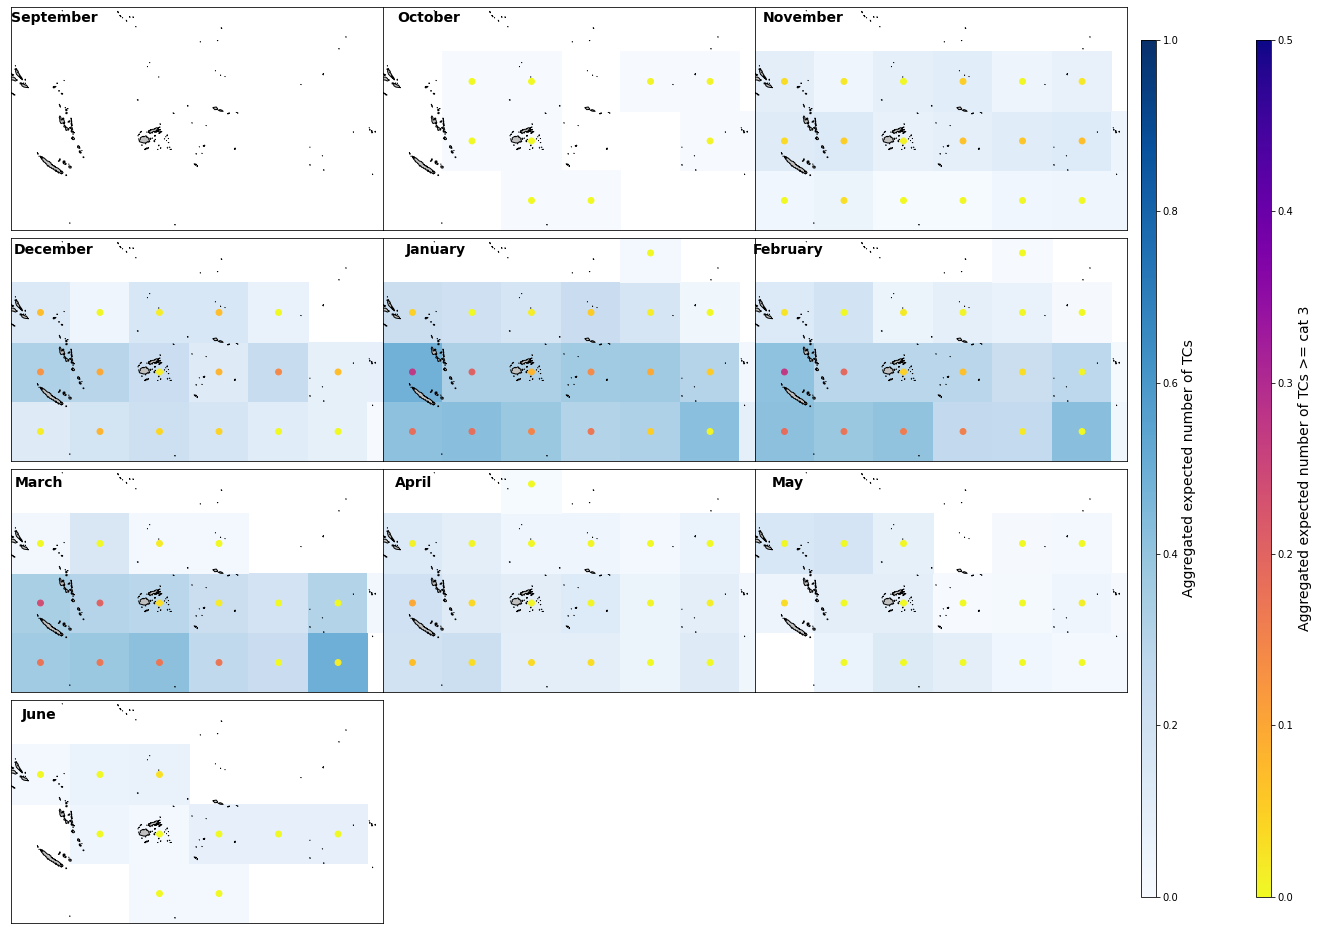
Monthly forecast#
Figure Explanation
The next figure displays the aggregated expected number of TCs and TCs category > 3 at the study site.
mean_day, mean_day_c3, mean_day_full_season, mean_day_full_season_c3, ds = variables_plot_forecast(
    p_fore_date,
    year, month,
    5, 8,
)
# first month of the forecast
plot_forecast_month(
    month, ds, 1, 0.5,
    mean_day, mean_day_c3,
    mean_day_full_season, mean_day_full_season_c3,
    35,
);
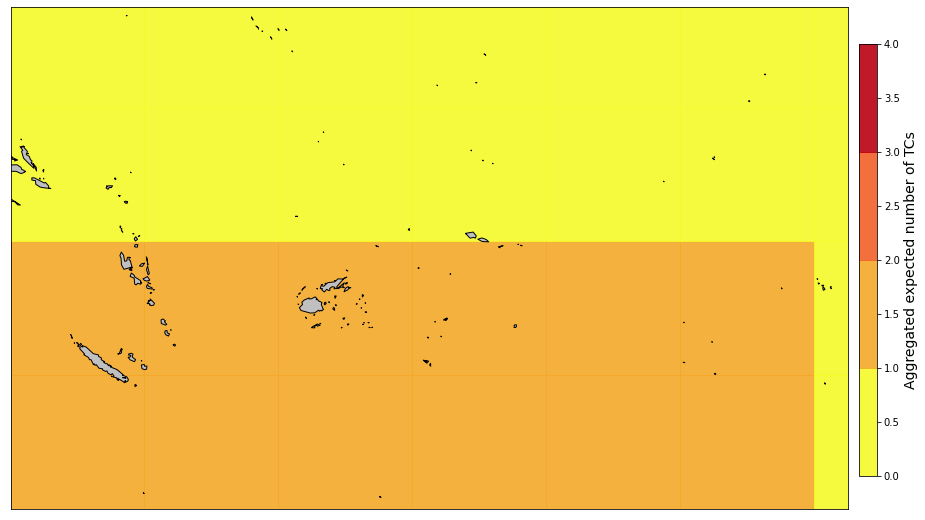
Seasonal forecast#
Figure Explanation
Seasonal forecast for TCs.
Aggregated expected number of TCs at the study site.
plot_seasonal_forecast(
    ds, 4,
    mean_day_full_season, mean_day_full_season,
    lop1, lop2, lap1, lap2,
);
Forecast outlook from different agencies#
RMSC Nadi (Fiji Meteorological Service), SP>25ºS
They generate TCs outlooks for the season, based in other seasons with similar patterns in the index NIÑO3.4.
There is a also a 5 days risk of cyclones outlook, consisting on maps.
They have as well maps of TC tracks prediction when there is TC activity at the moment.
IFrame(
    'https://www.met.gov.fj/index.php?page=climateOutlooks#Detailed_Outlook.pdf',
    width = 1000,
    height = 450,
    embed = True,
)
RMSC Wellington (Metservice) SP bellow 25ºS
They generate a bulletin with the position and forecast of the TC track a few days ahead. They also and upload infrared satellite images of the last day.
IFrame('https://www.metservice.com/warnings/tropical-cyclone-activity', width = 1000, height = 450)
Joint Typhoon Warning Center (JTWC)
When there is an alert of TC they published it with downloadable information in text file about the position, maximum sustained winds (1-min), radius at 34/50/64kt and 12-hour and 24-hour forecasts. They also generate annual reports.
GDACS (Global Disaster Alert and Coordination System)
This is not an official center but it is a system developed to centralize warnings and estimates of the impacts of natural disasters (including TCs, using the bulletins issued by the RMSC, TCWC and JTWC). It can be interesting to have it there to consult, they have quite a few maps, it includes the alerts of the last year, but they seem to not be as updated as the other outlooks since the current alerts later.
48-hr Tropical Cyclone Formation Probability Guidance Product
The NOAA provides maps in the East and West Pacific with the current TC genesis probability and other interesting variables such as SST.
IFrame('https://www.ssd.noaa.gov/PS/TROP/TCFP/west_pacific.html', width = 1000, height = 450)
print("execution end: {0}".format(datetime.today().strftime('%Y-%m-%d %H:%M:%S')))
execution end: 2022-09-11 22:06:48