Additional Predictand Variables
Contents
Additional Predictand Variables#
Sea Level Pressure (SLP)
Daily mean precipitation
# common
import os
import os.path as op
import sys

# pip
import xarray as xr

import warnings
warnings.filterwarnings("ignore")


# DEV: bluemath
sys.path.insert(0, op.join(op.abspath(''), '..',  '..', '..', '..'))

# bluemath modules
from bluemath.seasonal_forecast_tcs.ibtracs import load_storms_sp, genesis_cat_sp

from bluemath.seasonal_forecast_tcs.plotting.dwts import Plot_DWTs_Mean_Anom
Database and site parameters#
# database
p_data = r'/media/administrador/HD2/SamoaTonga/data'
site = 'SamoaTonga'
p_site = op.join(p_data, site)

# deliverable
p_deliv = op.join(p_site, 'seasonal_forecast_tcs')

# IBTrACS database
p_ibtracs = op.join(p_data, 'IBTrACS.ALL.v04r00.nc')

#KMA model
p_kma = op.join(p_deliv, 'kma')

# index predictor values
p_sst_mld_slp_calibration = op.join(p_deliv, 'sst_mld_slp_calibration.nc')

# precipitation in target area
p_xs_trmm = op.join(p_deliv, 'xs_trmm.nc')
Sea Level Pressure (SLP)#
# load data
xs = xr.open_dataset(p_sst_mld_slp_calibration)
xds_kma =  xr.open_dataset(p_kma+'/xds_kma_index_vars.nc')
xs_trmm =  xr.open_dataset(p_xs_trmm)
xds_kma_sel =  xr.open_dataset(p_kma+'/xds_kma_sel.nc')
# load TCs
xds_ibtracs, xds_SP = load_storms_sp(p_ibtracs)

st_lons = xds_SP.lon.values
st_lats = xds_SP.lat.values
All basins storms:  13549
SP basin storms:    1130
st_bmus = genesis_cat_sp(xds_SP, xds_kma)
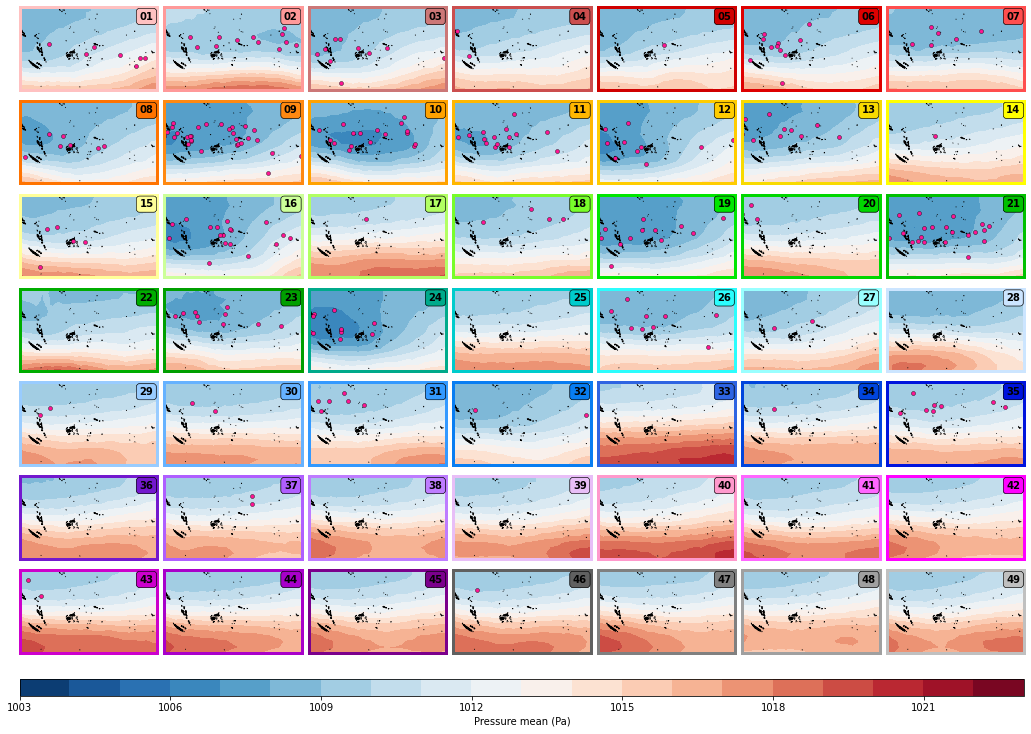
DWTs - SLP Mean:
# pressure > 1013mbar (anticiclon)
fig = Plot_DWTs_Mean_Anom(
    xds_kma, xs, ['slp'],
    minis = [1003],
    maxis = [1023],
    levels = [20],
    kind = 'mean',
    cmap = ['RdBu_r'],
    genesis = 'on',
    st_bmus = st_bmus,
    st_lons = st_lons,
    st_lats = st_lats,
    markercol = 'deeppink',
    markeredge = 'k',
);
slp: min(96041.796875) max(103900.296875)
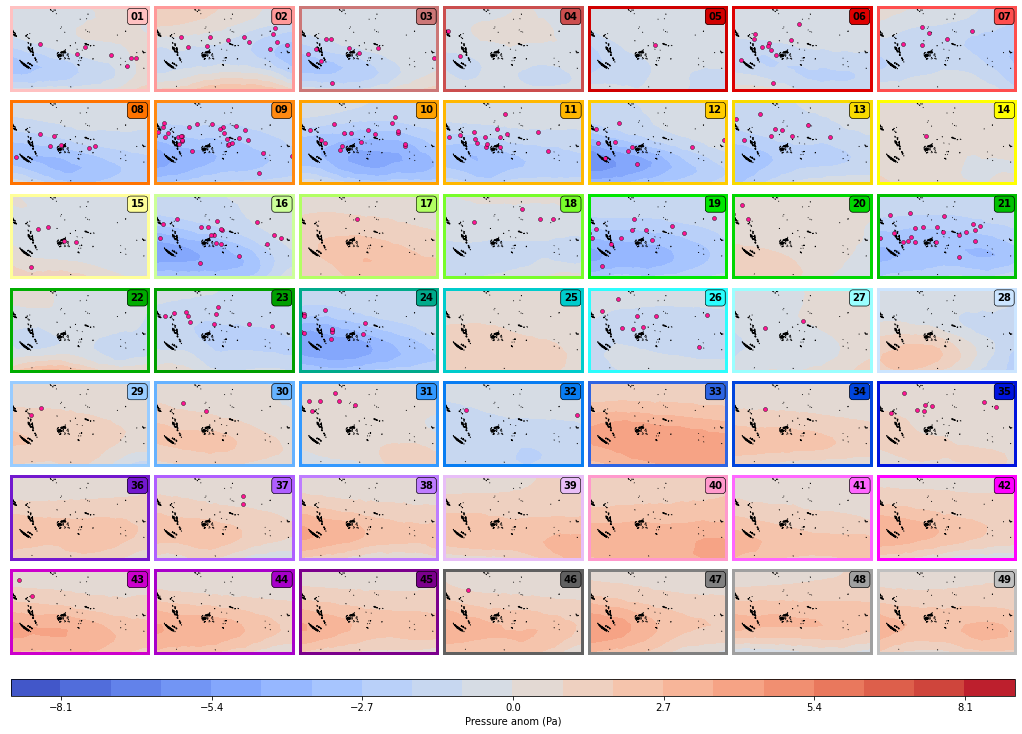
DWTs - SLP Anomalies
fig = Plot_DWTs_Mean_Anom(
    xds_kma, xs, ['slp'],
    minis = [-9],
    maxis = [9],
    levels = [20],
    kind = 'anom',
    cmap = ['coolwarm'],
    genesis = 'on',
    st_bmus = st_bmus,
    st_lons = st_lons,
    st_lats = st_lats,
    markercol = 'deeppink',
    markeredge = 'k',
);
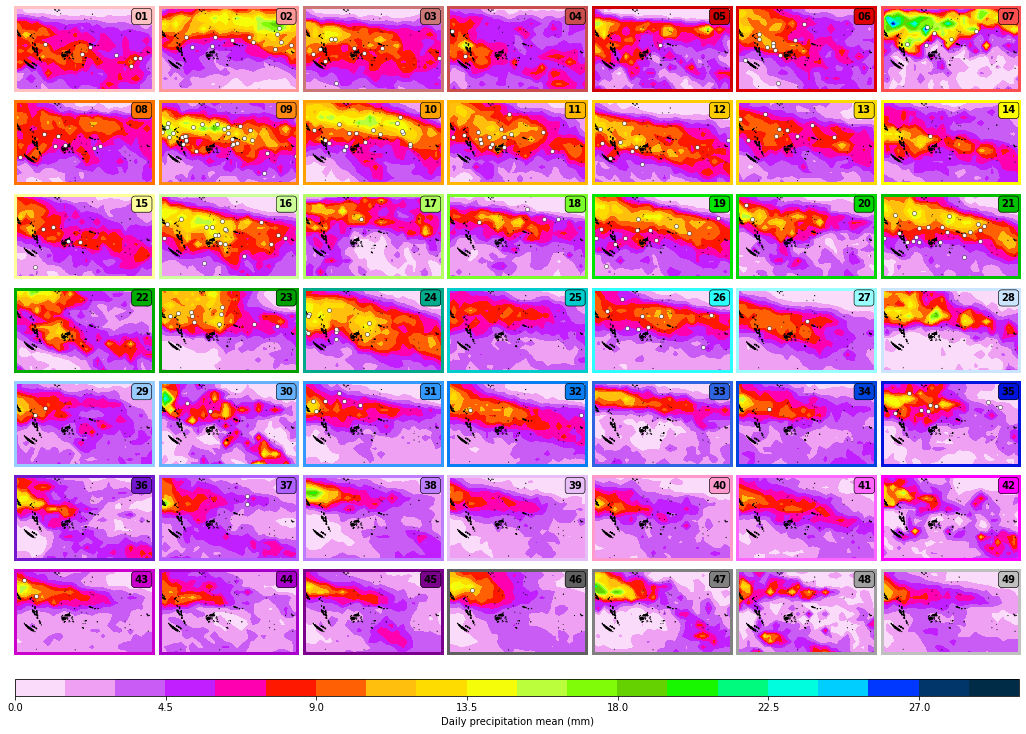
Daily Mean Precipitation#
DWTs - Daily Mean Precipiation Mean
fig = Plot_DWTs_Mean_Anom(
    xds_kma_sel, xs_trmm, ['precipitation'],
    minis = [0],
    maxis = [30],
    levels = [20],
    kind = 'mean',
    cmap = ['gist_ncar_r'],
    genesis = 'on',
    st_bmus = st_bmus,
    st_lons = st_lons,
    st_lats = st_lats,
    markercol = 'white',
    markeredge = 'k',
);
precipitation: min(0.0) max(635.4000244140625)
DWTs - Daily Mean Precipiation Anomalies
fig = Plot_DWTs_Mean_Anom(
    xds_kma_sel, xs_trmm, ['precipitation'],
    minis = [-20],
    maxis = [20],
    levels = [20],
    kind = 'anom',
    cmap = ['coolwarm'],
    genesis = 'on',
    st_bmus = st_bmus,
    st_lons = st_lons,
    st_lats = st_lats,
    markercol = 'mediumspringgreen',
    markeredge = 'k',
);
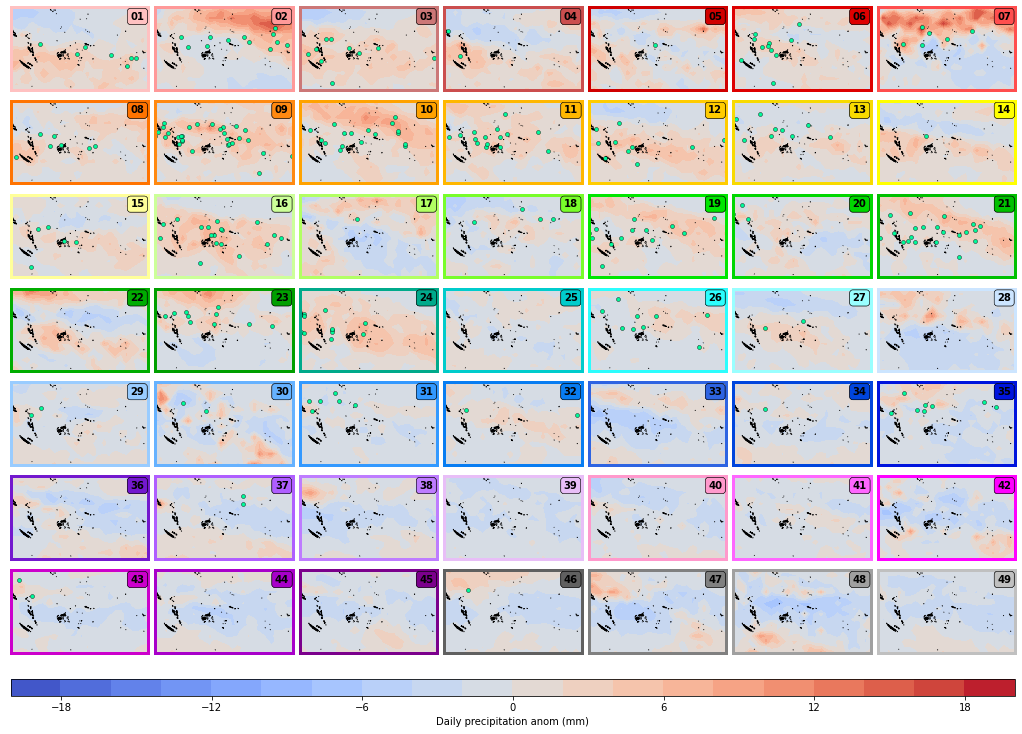
Clear patterns can be extracted from these figures related to TCs genesis. Most of it takes place under the following conditions:
Low pressure areas, with 1013 mba or lower values, corresponding generally to negative anomalies.
Intense but not extreme precipitation areas, from 9 to 16.5 mm/day, corresponding generally to red anomalies.
These conclusions add to the summary relationship predictand - predictors:
TC activity is focused in the first 28 DWTs (index clusters).
The TCs genesis activity is generally focused under the following conditions:
Index range values from 0.60 to 0.79, corresponding to positive anomalies.
In the warm SST zone, 28 - 30 º C, and where MLD values are smaller than 75 m; corresponding to mild positive SST anomalies and negative MLD anomalies.
In intense but not extreme precipitation areas, from 9 to 16.5 mm/day, corresponding generally to red anomalies.
In low pressure areas, with 1013 mba or lower values, corresponding generally to negative anomalies.