Index Predictor Definition and Building
Contents
Index Predictor Definition and Building#
# common
import os
import os.path as op
import sys
import pickle as pk

# pip
import numpy as np
import xarray as xr

# DEV: bluemath
sys.path.insert(0, op.join(op.abspath(''), '..', '..', '..', '..'))

# bluemath modules
from bluemath.seasonal_forecast_tcs.ibtracs import load_storms_sp, extract_tcs_rectangle, ds_index_sst_mld_slp_pp_calibration,\
dataframe_pressures_ibtracs, add_sst_mld, data_to_discret, ds_index_sst_mld_calibration, ds_trmm

from bluemath.seasonal_forecast_tcs.plotting.site import Plot_target_area, Plot_predictor_grid
from bluemath.seasonal_forecast_tcs.plotting.ibtracs import Plot_ibtracs_sst_mlp_pmin, Plot_index

import warnings
warnings.filterwarnings("ignore")
Database and site parameters#
# database
p_data = r'/media/administrador/HD2/SamoaTonga/data'
site = 'SamoaTonga'
p_site = op.join(p_data, site)

# deliverable
p_deliv = op.join(p_site, 'seasonal_forecast_tcs')

# IBTrACS database
p_ibtracs = op.join(p_data, 'IBTrACS.ALL.v04r00.nc')

# daily mean SST and MLD
p_sst = '/media/administrador/HD1/DATABASES/SeasonalForecast_TCs/SST'
p_mld = '/media/administrador/HD1/DATABASES/SeasonalForecast_TCs/CFS/ocnmld'

# precipitation
p_trmm = '/media/administrador/HD1/DATABASES/SeasonalForecast_TCs/TRMM_daily'

# sea level pressure
p_slp = '/media/administrador/HD1/DATABASES/SeasonalForecast_TCs/CFS'

# output files:
p_out_pmin_sst_mld = op.join(p_deliv, 'df_coordinates_pmin_sst_mld.pkl')
p_out_pmin_sst_mld_2021 = op.join(p_deliv, 'df_coordinates_pmin_sst_mld_2021.pkl')
p_out_sst_mld_calibration = op.join(p_deliv, 'sst_mld_calibration.nc')
p_out_sst_mld_slp_calibration = op.join(p_deliv, 'sst_mld_slp_calibration.nc')
p_out_trmm = op.join(p_deliv, 'xs_trmm.nc')

if not op.isdir(p_deliv):
    os.makedirs(p_deliv)
# predictor parameters
lo_area = [160, 210]
la_area = [-30, 0]

lo_SP, la_SP = [130, 250], [-60, 0]
lop = 160.25
lop2 = 211
lap = -0.25
lap2 = -32
delta = 2

# ibtracs v4 dictionary
d_vns = {
    'longitude': 'lon',
    'latitude': 'lat',
    'time': 'time',
    'pressure': 'wmo_pres',
}

# calibration years index
y_cali_index = 5184
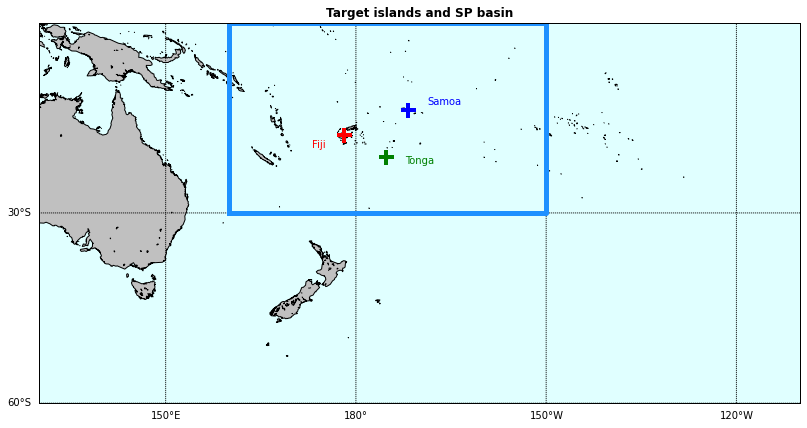
Spatial and temporal domain#
The predictor area spans around the islands of Tonga, Samoa and Fiji, from latitude 0º to 30º and from longitude 160º to 210º; far enough to be able to identify regional as well as local patterns. The calibration period (time domain) is defined from 1982 to 2019.
Plot_target_area(rectangle=[lo_area[0], lo_area[1], la_area[0], la_area[1]]);
The variables required for the methodology are downloaded from the databases:
Predictand: Tropical cyclones tracks from IBTrACs, for the minimum pressure point.
Predictor: NOAA 1/4º daily Optimum Interpolation Sea Surface Temperature (SST) and Mixed Layer Depth (MLD) from the NCEP Climate Forecast System Reanalysis (CFSR).
xds_ibtracs, xds_SP = load_storms_sp(p_ibtracs)
All basins storms:  13549
SP basin storms:    1130
# extract TCs inside rectangle, 772 a 780
TCs_rect_hist_tracks = extract_tcs_rectangle(
    xds_SP,
    lo_area[0], lo_area[1], la_area[0], la_area[1],
    d_vns,
)
df0 = dataframe_pressures_ibtracs(xds_ibtracs)
df0[6000:6010]
| st | time | lon | lat | pres | |
|---|---|---|---|---|---|
| 6000 | 9832 | 1987-02-12 12:00:00.000040448 | 139.125000 | -15.225000 | 970.0 |
| 6001 | 9832 | 1987-02-12 18:00:00.000040448 | 139.817963 | -15.790068 | 970.0 |
| 6002 | 9832 | 1987-02-13 00:00:00.000040448 | 140.160004 | -16.719999 | 970.0 |
| 6003 | 9832 | 1987-02-13 06:00:00.000040448 | 140.032623 | -17.892567 | 980.0 |
| 6004 | 9832 | 1987-02-13 12:00:00.000040448 | 139.699997 | -19.200003 | 996.0 |
| 6005 | 9832 | 1987-02-13 18:00:00.000040448 | 139.480362 | -20.108568 | 998.0 |
| 6006 | 9832 | 1987-02-14 00:00:00.000040448 | 139.399994 | -21.100000 | 1001.0 |
| 6007 | 9834 | 1987-02-07 12:00:00.000040448 | 161.800003 | -13.050001 | 990.0 |
| 6008 | 9834 | 1987-02-07 18:00:00.000040448 | 163.449997 | -13.150000 | 995.0 |
| 6009 | 9834 | 1987-02-08 00:00:00.000040448 | 166.242844 | -14.371429 | 997.0 |
# TODO guardar df_2021 antes de hacer este corte de tiempo, despues guardar el cortado como df_2019
df0 = df0[(df0['time'] < '2021-01-31 ')]
df = add_sst_mld(df0, p_sst, p_mld, lo_area[0], lo_area[1], la_area[0], la_area[1])

# years of the calibration period
df_cali = df.drop(df.index[y_cali_index:])

# show data
df.tail()

# store dataframe
with open(p_out_pmin_sst_mld_2021, 'wb') as f:
    pk.dump(df, f)
Start time:  2022-03-28 16:34:01.168824
End time:    2022-03-28 16:38:07.860781
For the calibration period the points with pressure, SST and MLD data in the target area are kept.
# TODO mld database stops at 2021-02-01, use only df0 data till 2020
df0 = df0[(df0['time'] < '2020-01-01 ')]
df = add_sst_mld(df0, p_sst, p_mld, lo_area[0], lo_area[1], la_area[0], la_area[1])

# years of the calibration period
df_cali = df.drop(df.index[y_cali_index:])

# show data
df.tail()

# store dataframe
with open(p_out_pmin_sst_mld, 'wb') as f:
    pk.dump(df, f)

print(df)
Start time:  2022-03-28 16:38:27.970073
End time:    2022-03-28 16:42:15.958994

          st                          time         lon        lat    pres  \
4471    9245 1981-12-18 12:00:00.000040448  172.000000  -9.000000   997.0
4472    9245 1981-12-19 00:00:00.000040448  169.950012  -9.450001   997.0
4473    9245 1981-12-19 12:00:00.000040448  169.000000  -9.800001   990.0
4474    9245 1981-12-20 00:00:00.000040448  168.199997 -11.000000   987.0
4475    9245 1981-12-20 12:00:00.000040448  167.399994 -12.200000   980.0
...      ...                           ...         ...        ...     ...
14687  13353 2019-12-31 06:00:00.000039936  185.616379 -20.368277   999.0
14688  13353 2019-12-31 09:00:00.000039936  186.182968 -20.301870   999.0
14689  13353 2019-12-31 12:00:00.000039936  186.849609 -20.312431  1000.0
14690  13353 2019-12-31 15:00:00.000039936  187.731110 -20.379351  1000.0
14691  13353 2019-12-31 18:00:00.000039936  188.699997 -20.499998  1001.0

             sst        mld
4471   29.580000  64.541672
4472   27.840000  80.874992
4473   28.859999  66.666664
4474   28.719999  68.333336
4475   28.750000  56.750000
...          ...        ...
14687  25.750000  40.666668
14688  25.199999  43.166664
14689  26.049999  42.666664
14690  27.029999  35.708336
14691  26.430000  42.999996

[5311 rows x 7 columns]
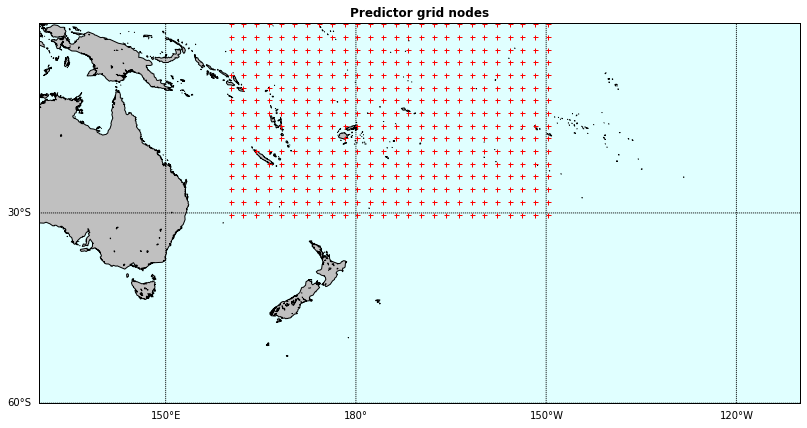
Predictor grid and data processing#
The historical datasets are interpolated into the a 1/2º grid resolution, defining this way the grid for the predictor in the target area.
Plot_predictor_grid(delta, lop, lop2, lap, lap2, lo_SP, la_SP);
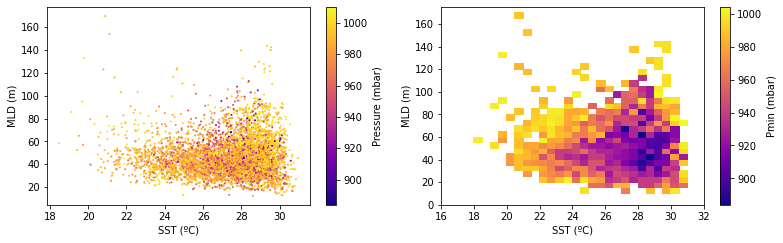
MLD, SST and Pmin data plotted after preprocessing (left) and the same data after discretization in intervals of 0.5 m and 0.5ºC respectively (right):
Plot_ibtracs_sst_mlp_pmin(df);
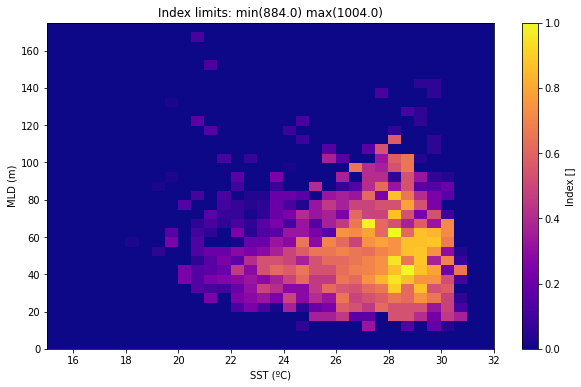
Index definition and computation#
The historic datasets are combined into the tailor-made index predictor. It is built from the combination of SST-MLD-Pmin of the coordinate dataset previously generated. For simplicity the index will range from 0 to 1, so the pressure range is rescaled in this range.
# discretization: 0.5ºC (SST), 5m (MLD)
xx, yy, zz = data_to_discret(
    df['sst'].values, df['mld'].values, 0.5, 5,
    df['pres'].values, 15, 32, 0, 175,
    option = 'min',
)

# index function
index = zz
fmin, fmax = np.nanmin(zz), np.nanmax(zz)
index_zz = (fmax - index) / (fmax-fmin)

# remove nan
index_zz[np.isnan(index_zz)] = 0
The index predictor function:
indexi = (Pmax - Pi) / (Pmax - Pmin)
The index plotted in the MLD-SST space:
Plot_index(xx, yy, zz, index_zz);
Final dataset including all the variable and the index predictor values in the predictor grid.
xs = ds_index_sst_mld_calibration(p_sst, p_mld, df, lop, lop2, lap, lap2, delta)
print(xs)

# store output
xs.to_netcdf(p_out_sst_mld_calibration)
Start time:  2022-03-28 16:42:17.003093
End   time:  2022-03-28 16:42:19.678729
Merge time:  2022-03-28 17:06:20.837717

<xarray.Dataset>
Dimensions:  (lat: 16, lon: 26, time: 13879)
Coordinates:
  * time     (time) datetime64[ns] 1982-01-01 1982-01-02 ... 2019-12-31
  * lat      (lat) float64 -0.25 -2.25 -4.25 -6.25 ... -26.25 -28.25 -30.25
  * lon      (lon) float64 160.2 162.2 164.2 166.2 ... 204.2 206.2 208.2 210.2
Data variables:
    index    (time, lat, lon) float64 0.3667 0.05833 0.0 ... 0.1167 0.2417 0.0
    sst      (time, lat, lon) float32 30.77 30.95 30.03 ... 23.1 22.85 22.9
    dbss     (time, lat, lon) float32 19.38 28.42 76.08 ... 24.33 23.88 19.75
    mask     (lat, lon) float64 0.0 0.0 0.0 0.0 0.0 0.0 ... 0.0 0.0 0.0 0.0 0.0
xs_f = ds_index_sst_mld_slp_pp_calibration(p_slp,xs,lop,lop2,lap,lap2,delta)
print(xs_f)

# store output
xs_f.to_netcdf(p_out_sst_mld_slp_calibration)
Start time:  2022-03-28 17:06:42.644581
End   time:  2022-03-28 17:06:45.370540
Merge time:  2022-03-28 17:14:12.342342

<xarray.Dataset>
Dimensions:  (lat: 16, lon: 26, time: 13879)
Coordinates:
  * time     (time) datetime64[ns] 1982-01-01 1982-01-02 ... 2019-12-31
  * lat      (lat) float64 -0.25 -2.25 -4.25 -6.25 ... -26.25 -28.25 -30.25
  * lon      (lon) float64 160.2 162.2 164.2 166.2 ... 204.2 206.2 208.2 210.2
Data variables:
    index    (time, lat, lon) float64 0.3667 0.05833 0.0 ... 0.1167 0.2417 0.0
    sst      (time, lat, lon) float32 30.77 30.95 30.03 ... 23.1 22.85 22.9
    dbss     (time, lat, lon) float32 19.38 28.42 76.08 ... 24.33 23.88 19.75
    mask     (lat, lon) float64 0.0 0.0 0.0 0.0 0.0 0.0 ... 0.0 0.0 0.0 0.0 0.0
    slp      (time, lat, lon) float32 1.01e+05 1.01e+05 ... 1.009e+05 1.011e+05
# extract TRMM
xs_trmm = ds_trmm(p_trmm, lop, lop2, lap, lap2, delta)
print(xs_trmm)

# store output
xs_trmm.to_netcdf(p_out_trmm)
Start time:  2022-03-28 17:14:12.403624
End   time:  2022-03-28 17:14:14.614323
Merge time:  2022-03-28 17:22:01.740134

<xarray.Dataset>
Dimensions:        (lat: 16, lon: 26, time: 8034)
Coordinates:
  * time           (time) datetime64[ns] 1998-01-01 1998-01-02 ... 2019-12-30
  * lat            (lat) float64 -0.25 -2.25 -4.25 ... -26.25 -28.25 -30.25
  * lon            (lon) float64 160.2 162.2 164.2 166.2 ... 206.2 208.2 210.2
Data variables:
    precipitation  (time, lat, lon) float32 2.46 0.18 0.84 1.2 ... 0.0 0.0 0.0