Databases
Databases#
# import image module
from IPython.display import Image
Sea Surface Temperature (SST): The NOAA 1/4° daily Optimum Interpolation Sea Surface Temperature or daily OISST is an analysis constructed by combining observations from different platforms (satellites, ships, buoys and Argo floats) on a regular global grid.More information at the OISST NOAA webpage.
CFS (Climate Forecast System): It is a model produced by several dozen scientists under guidance from the National Centers for Environmental Prediction (NCEP), which offers hourly data with a horizontal resolution down to 1/2º. Mixed Layer Depth (MLD), Mean Sea Level Pressure (SLP) and forecast data from both SST and MLD. More information at the NOAA webpage.
Daily mean precipitation: It is generated from the research-quality 3-hourly TRMM Multi-Satellite Precipitation Analysis TMPA (3B42). Simple summation of valid retrievals in a grid cell is applied for the data day. The result is given in (mm). More information at the NASA webpage.
Madden-Jullian Oscillation (MJO): It includes MJO date (day, month and year), RMM1, RMM2, phase (1 to 8) and amplitude. More information at the MJO Australian Bureau of Meteorology.
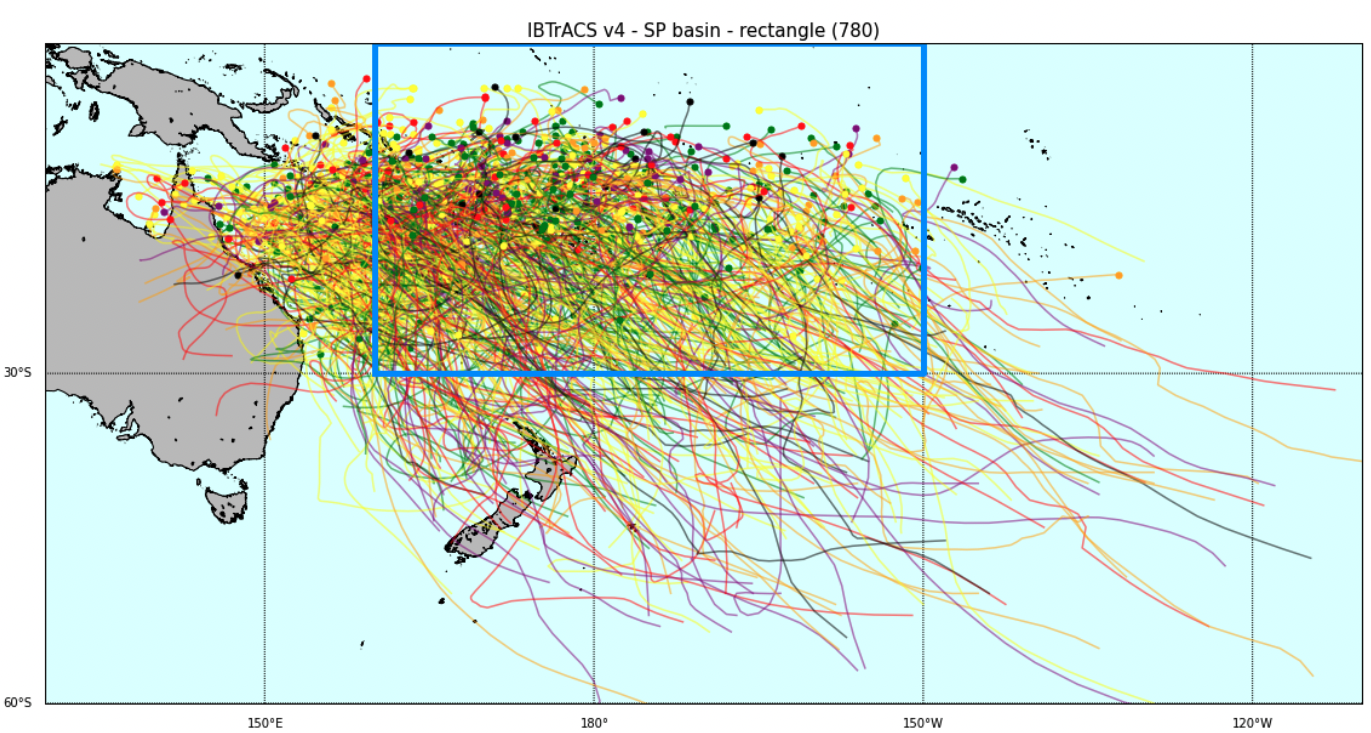
IBTrACS v4: This global dataset compiles an inventory of tropical cyclones (TCs) reported worldwide with their characteristics (Knapp et al. 2010). Various parameters among which are the best-track position and intensity are provided at 6-h intervals . Data sources are each World Meteorological Organization (WMO) Regional Specialized Meteorological Centers (RSMCs) and Tropical Cyclone Warning Centres (TCWCs), as well as other national agencies. Data for some basins are available as early as 1850. Data can be accessed and downloaded at NOAA webpage.
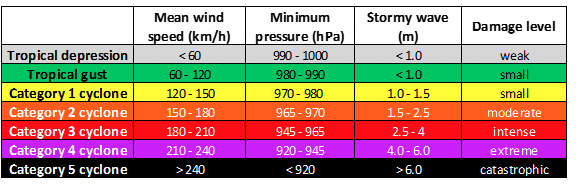
Saffir-Simpson classification scale of tropical cyclones. Each category has been assigned a color used for all the figures in the work: