Vulnerability
Contents
Vulnerability#
import os
import os.path as op
import sys
import glob

import numpy as np
import pandas as pd

# plot
import matplotlib.pyplot as plt
sys.path.insert(0, op.join(os.getcwd(), '..',  'lib'))


from damage_functions import damage_curves, plotDamageCurve
from config import *
dam_buildings_flood, dam_roads_flood, dam_crops_flood, dam_specials_flood, dam_buildings_wind, dam_crops_wind, dam_specials_wind = damage_curves()
Coastal and Ranfaill Flooding depth-damage curves#
plt.style.use('seaborn')
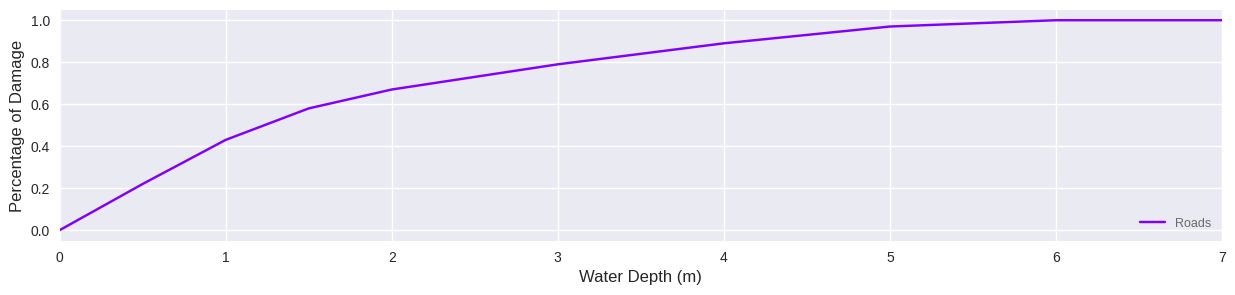
Roads#
colors = plt.cm.rainbow(np.linspace(0, 1, len(dam_roads_flood)))
plotDamageCurve(dam_roads_flood, colors, 'Percentage of Damage', 'Water Depth (m)', [0,7])
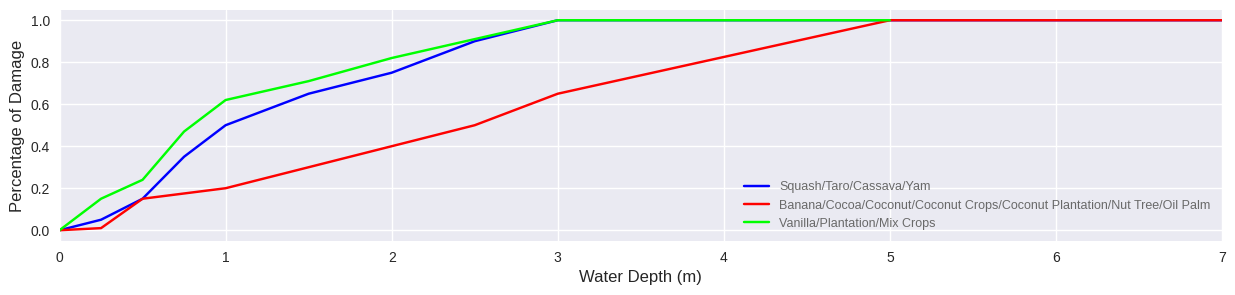
Land Crops#
colors = plt.cm.brg(np.linspace(0, 1, len(dam_crops_flood)))
plotDamageCurve(dam_crops_flood, colors, 'Percentage of Damage', 'Water Depth (m)', [0,7])
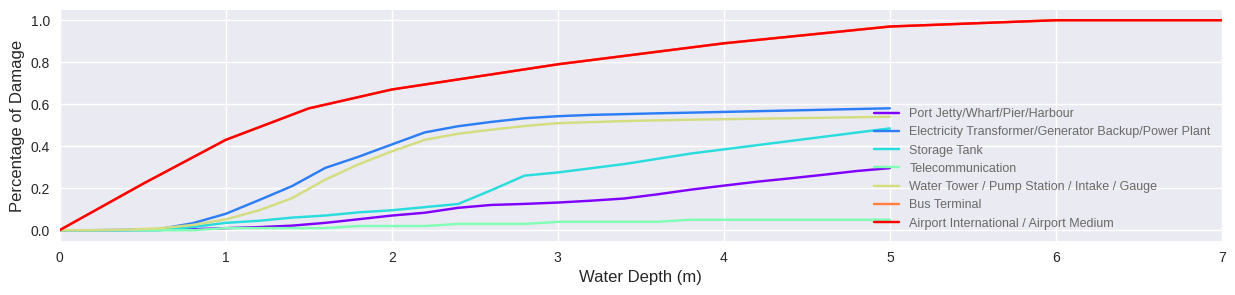
Special Infrastructures#
colors = plt.cm.rainbow(np.linspace(0, 1, len(dam_specials_flood)))
plotDamageCurve(dam_specials_flood, colors, 'Percentage of Damage', 'Water Depth (m)', [0,7])
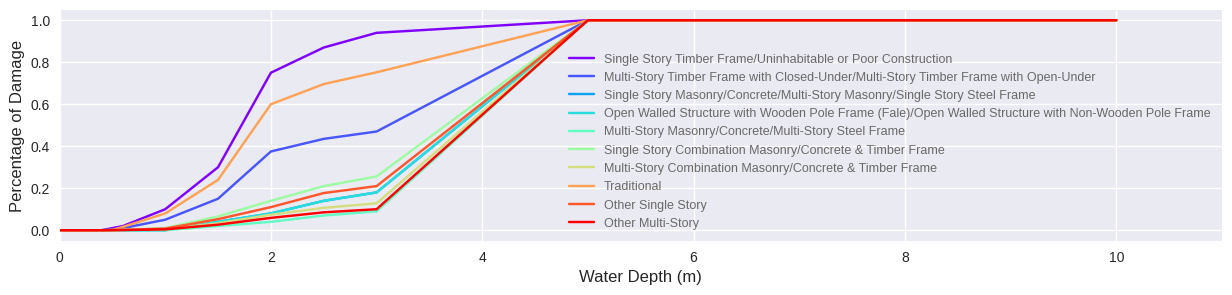
Buildings#
colors = plt.cm.rainbow(np.linspace(0, 1, len(dam_buildings_flood)))
plotDamageCurve(dam_buildings_flood, colors, 'Percentage of Damage', 'Water Depth (m)', [0,11])
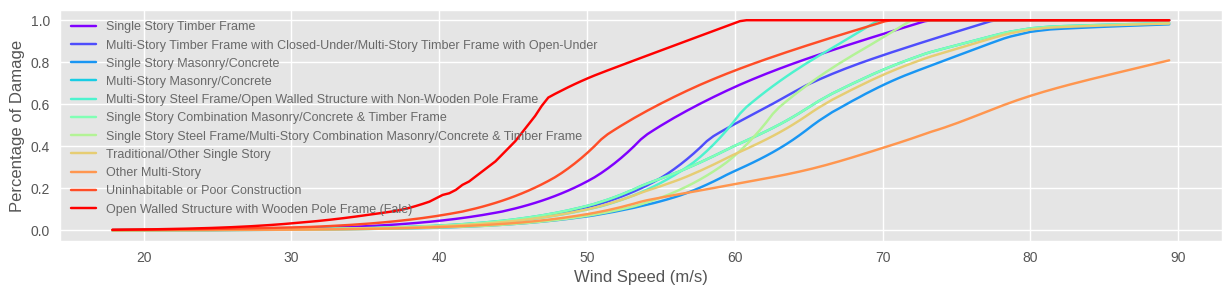
Wind damage curves#
plt.style.use('ggplot')
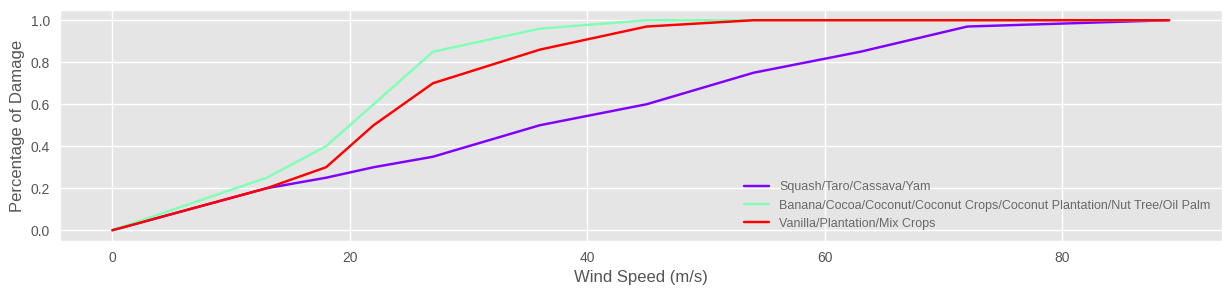
Land Crops#
colors = plt.cm.rainbow(np.linspace(0, 1, len(dam_crops_wind)))
plotDamageCurve(dam_crops_wind, colors, 'Percentage of Damage', 'Wind Speed (m/s)', [None, None])
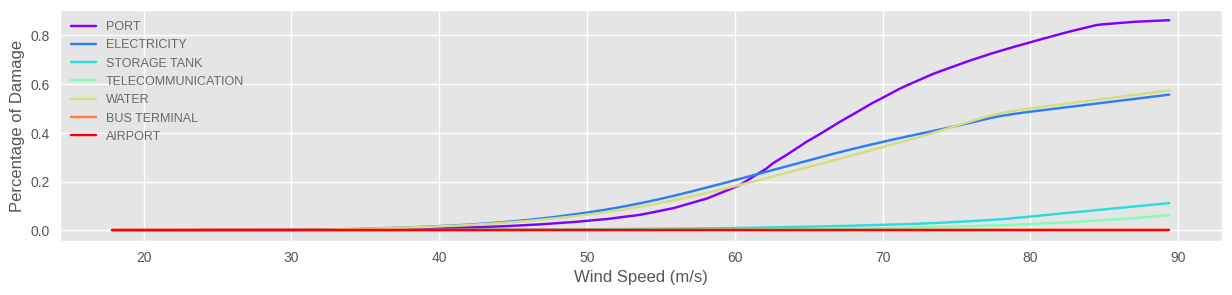
Special Infrastructures#
colors = plt.cm.rainbow(np.linspace(0, 1, len(dam_specials_wind)))
plotDamageCurve(dam_specials_wind, colors, 'Percentage of Damage', 'Wind Speed (m/s)',  [None, None], 'upper left')
Buildings#
colors = plt.cm.rainbow(np.linspace(0, 1, len(dam_buildings_wind)))
plotDamageCurve(dam_buildings_wind, colors, 'Percentage of Damage', 'Wind Speed (m/s)', [None, None], 'upper left')