Exposure
Contents
Exposure#
import os
import os.path as op
import sys

import numpy as np
import pandas as pd
import xarray as xr

# plot
import cmocean
import matplotlib.pyplot as plt
from matplotlib.gridspec import GridSpec

# geospatial
import rioxarray

# dependencies
sys.path.insert(0, op.join(os.getcwd(), '..', 'lib'))

from plot import Map
from config import *
from data_process import *
island = 'samoa'
# path to exposure shapefiles
p_data = op.join(os.getcwd(), '..', 'data')

p_shp_up= op.join(p_data, '..', 'riskscape', 'io', 'io_upolu', 'data')
p_shp_sv= op.join(p_data, '..', 'riskscape', 'io', 'io_savaii', 'data')
# load bathymetry and dem
bathy = rioxarray.open_rasterio(op.join(p_data, '{0}_smooth_utm.tif'.format(island))).drop('band').squeeze()
dem_savaii = xr.open_dataset(op.join(p_data, 'savaii_5m.nc')).isel(x=slice(None, None, 20), y=slice(None, None, 20))
dem_upolu = xr.open_dataset(op.join(p_data, 'upolu_5m.nc')).isel(x=slice(None, None, 20), y=slice(None, None, 20))
dem_samoa = xr.merge([dem_savaii.sel(x=slice(None, dem_upolu.x.min()-10)), dem_upolu])
dem_samoa = dem_samoa.where(dem_samoa > 0)
# load eposure shapefiles
crops_up, roads_up, specials_up, buildings_up, people_up, rivers_up = read_shp_exposure(p_shp_up, 'upolu')
crops_sv, roads_sv, specials_sv, buildings_sv, people_sv, rivers_sv = read_shp_exposure(p_shp_sv, 'savaii')

crops = pd.concat([crops_up, crops_sv])
roads = pd.concat([roads_up, roads_sv])
specials = pd.concat([specials_up, specials_sv])
buildings = pd.concat([buildings_up, buildings_sv])
# Initialize Map Constructor
mapExp = Map()
mapExp.bathy = bathy
mapExp.dem = dem_samoa
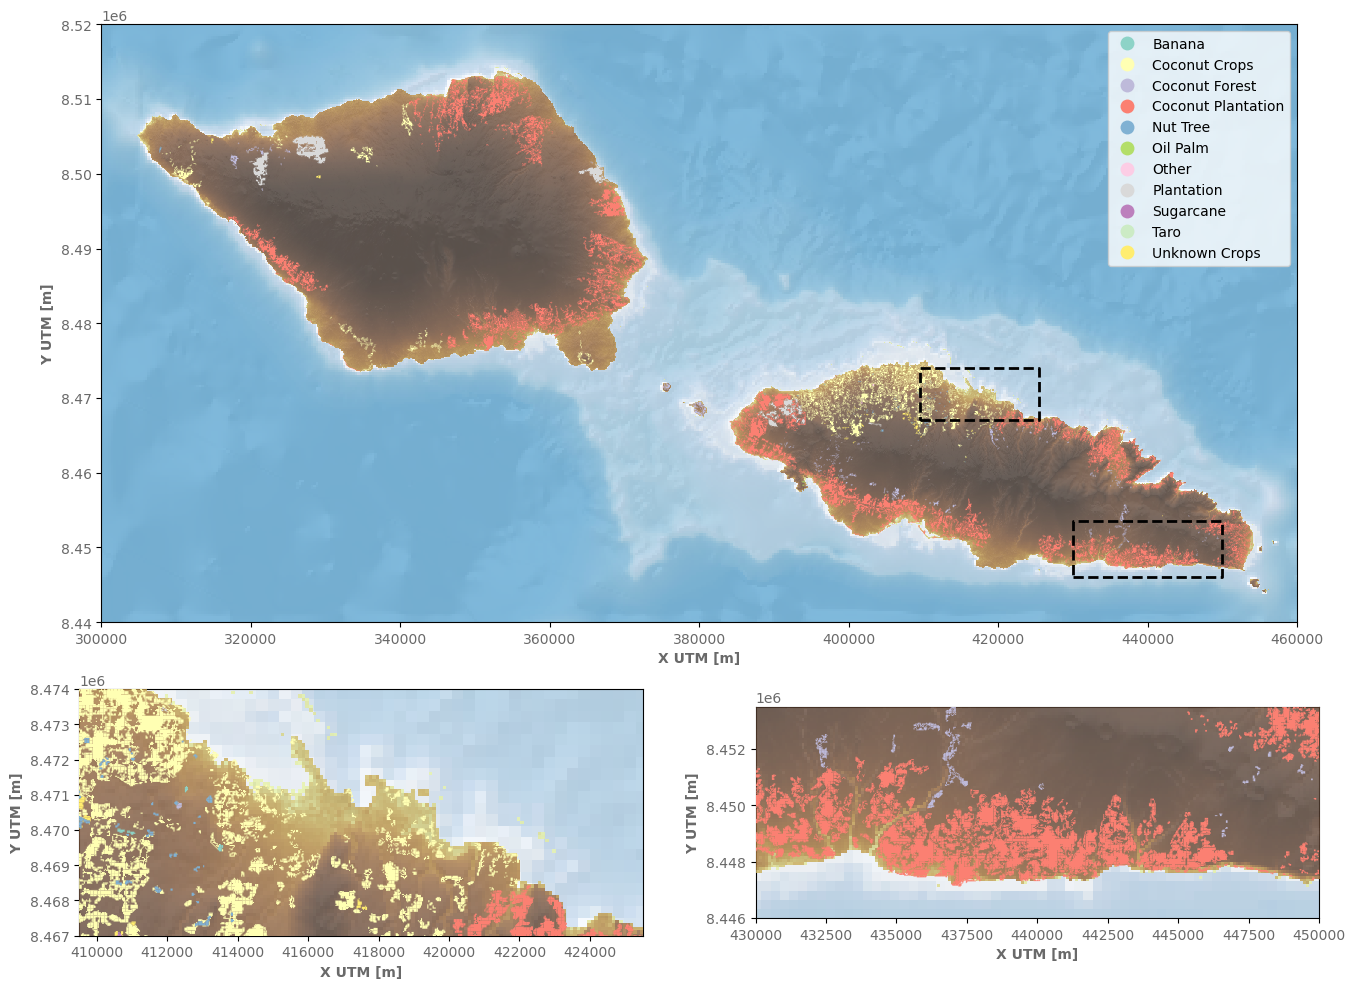
Land Crops#
fig = plt.figure(constrained_layout=False, figsize=(16,12))
gs = GridSpec(3, 2, figure=fig)

ax0 = fig.add_subplot(gs[0:2, :])
ax0 = mapExp.BackGround_2cmaps(fig, ax0, samoa_extent, plt.cm.Blues_r, cmocean.cm.turbid,  apia_extent, lepa_extent, vmin=-2000, vmax=1000, cbar=False, alpha=0.9)
crops.plot(column='CLASS_NAME', legend=True, ax=ax0, cmap='Set3', zorder=5)

ax1 = fig.add_subplot(gs[2, 0])
ax1 = mapExp.BackGround_2cmaps(fig, ax1, apia_extent, plt.cm.Blues_r, cmocean.cm.turbid, vmin=-2000, vmax=1000, cbar=False, alpha=0.9)
crops.plot(column='CLASS_NAME', legend=False, ax=ax1, cmap='Set3', zorder=5)

ax2 = fig.add_subplot(gs[2, 1])
ax2 = mapExp.BackGround_2cmaps(fig, ax2, lepa_extent, plt.cm.Blues_r, cmocean.cm.turbid, vmin=-2000, vmax=1000, cbar=False, alpha=0.9)
crops.plot(column='CLASS_NAME', legend=False, ax=ax2, cmap='Set3', zorder=5)

plt.show()
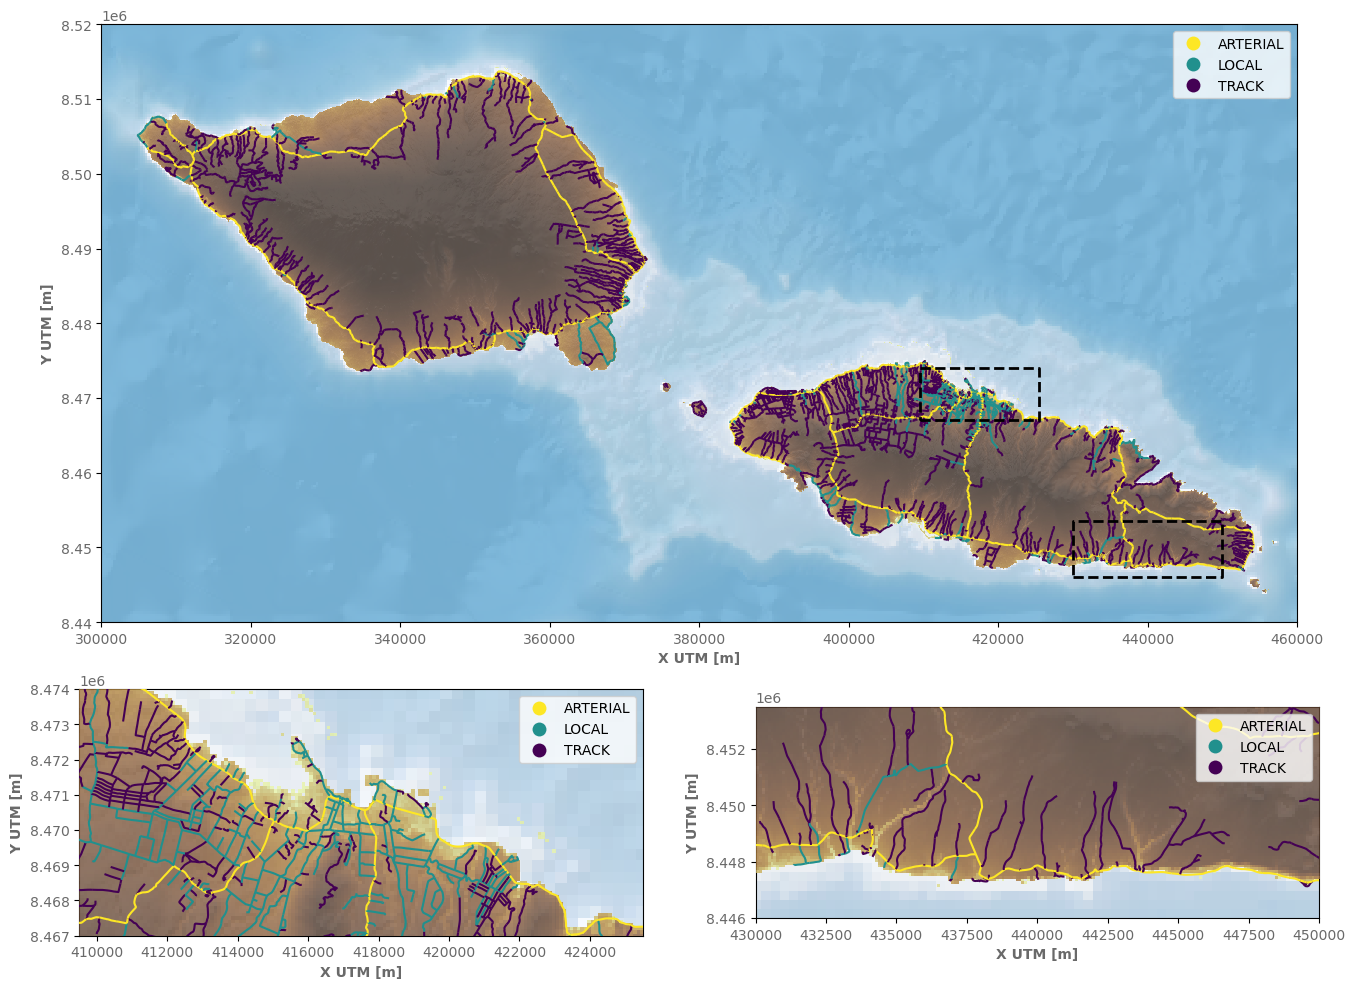
Roads#
fig = plt.figure(constrained_layout=False, figsize=(16,12))
gs = GridSpec(3, 2, figure=fig)

ax0 = fig.add_subplot(gs[0:2, :])
ax0 = mapExp.BackGround_2cmaps(fig, ax0, samoa_extent, plt.cm.Blues_r, cmocean.cm.turbid,  apia_extent, lepa_extent, vmin=-2000, vmax=1000, cbar=False, alpha=0.9)
roads.plot(column='CLASS', categorical=True, ax=ax0, legend=True, cmap='viridis_r', zorder=5)

ax1 = fig.add_subplot(gs[2, 0])
ax1 = mapExp.BackGround_2cmaps(fig, ax1, apia_extent, plt.cm.Blues_r, cmocean.cm.turbid, vmin=-2000, vmax=1000, cbar=False, alpha=0.9)
roads.plot(column='CLASS', categorical=True, ax=ax1, legend=True, cmap='viridis_r', zorder=5)

ax2 = fig.add_subplot(gs[2, 1])
ax2 = mapExp.BackGround_2cmaps(fig, ax2, lepa_extent, plt.cm.Blues_r, cmocean.cm.turbid, vmin=-2000, vmax=1000, cbar=False, alpha=0.9)
roads.plot(column='CLASS', categorical=True, ax=ax2, legend=True, cmap='viridis_r', zorder=5)

plt.show()
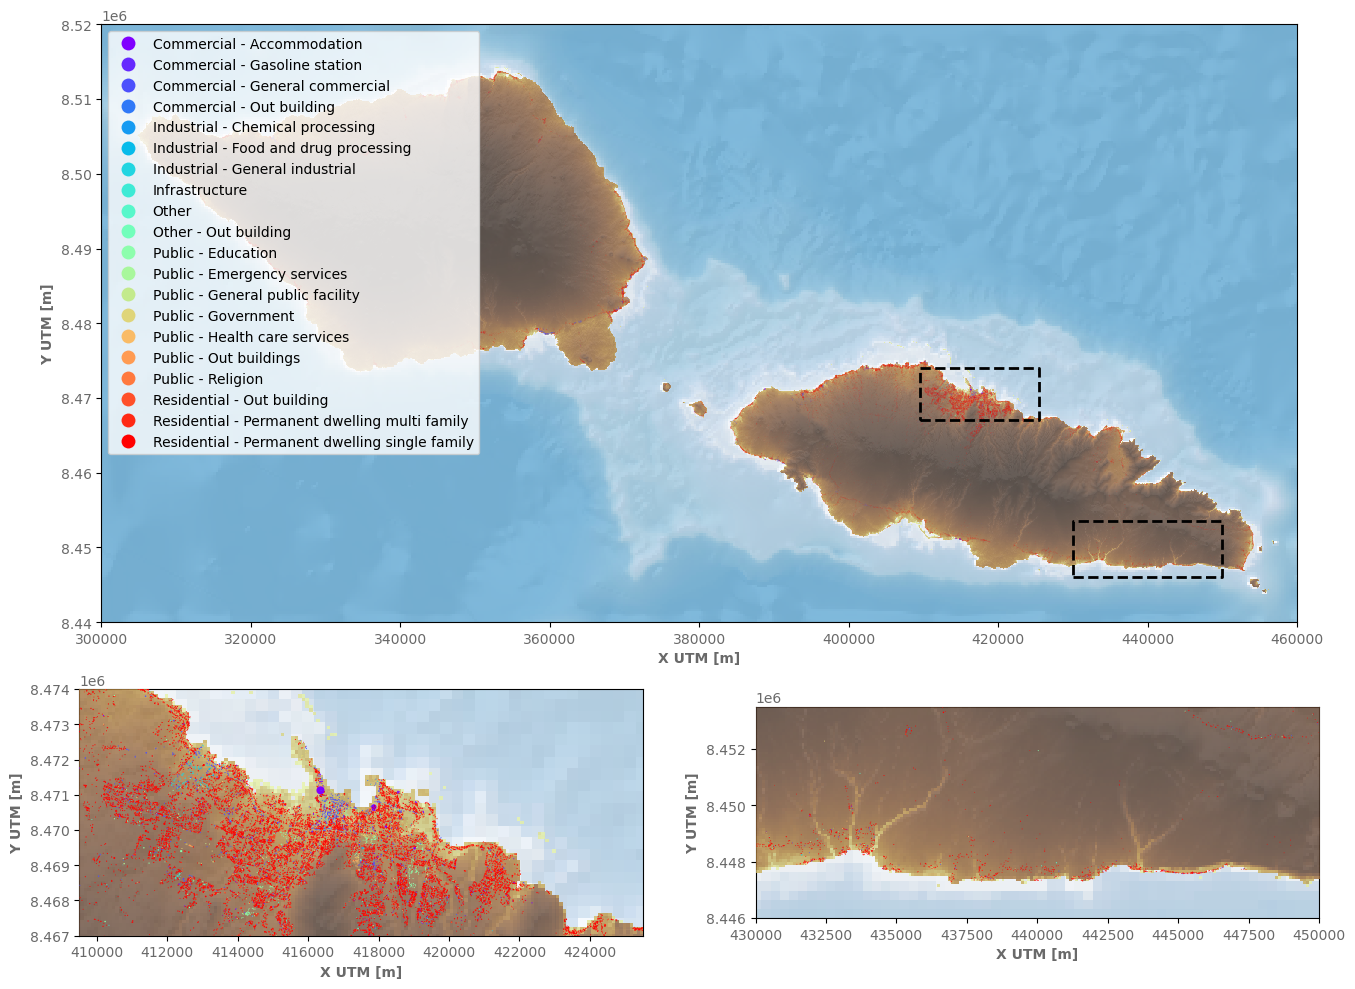
Buildings#
# Widen the geometry shape of buildings
buildings['geometry'] = buildings.geometry.buffer(10)
fig = plt.figure(constrained_layout=False, figsize=(16,12))
gs = GridSpec(3, 2, figure=fig)

ax0 = fig.add_subplot(gs[0:2, :])
ax0 = mapExp.BackGround_2cmaps(fig, ax0, samoa_extent, plt.cm.Blues_r, cmocean.cm.turbid,  apia_extent, lepa_extent, vmin=-2000, vmax=1000, cbar=False, alpha=0.9)
buildings.plot(column='Occ', categorical=True, ax=ax0, legend=True, cmap='rainbow', zorder=5)

ax1 = fig.add_subplot(gs[2, 0])
ax1 = mapExp.BackGround_2cmaps(fig, ax1, apia_extent, plt.cm.Blues_r, cmocean.cm.turbid, vmin=-2000, vmax=1000, cbar=False, alpha=0.9)
buildings.plot(column='Occ', categorical=True, ax=ax1, legend=False, cmap='rainbow', zorder=5)

ax2 = fig.add_subplot(gs[2, 1])
ax2 = mapExp.BackGround_2cmaps(fig, ax2, lepa_extent, plt.cm.Blues_r, cmocean.cm.turbid, vmin=-2000, vmax=1000, cbar=False, alpha=0.9)
buildings.plot(column='Occ', categorical=True, ax=ax2, legend=False, cmap='rainbow', zorder=5)

plt.show()
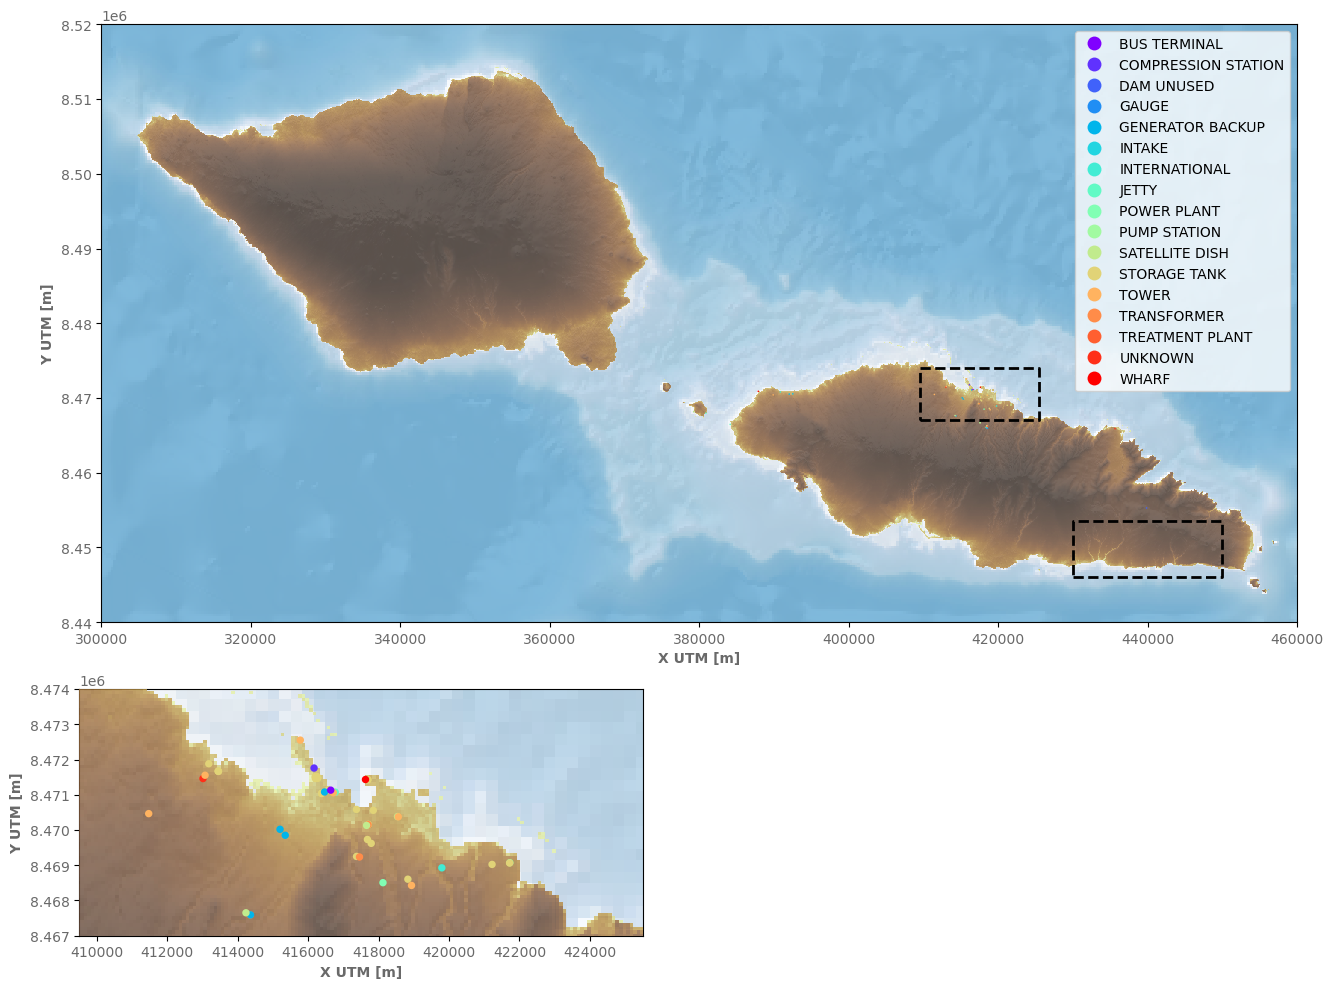
Special Infrastructures#
# Widen the geometry shape of buildings
specials['geometry'] = specials.geometry.buffer(100)
fig = plt.figure(constrained_layout=False, figsize=(16,12))
gs = GridSpec(3, 2, figure=fig)

ax0 = fig.add_subplot(gs[0:2, :])
ax0 = mapExp.BackGround_2cmaps(fig, ax0, samoa_extent, plt.cm.Blues_r, cmocean.cm.turbid,  apia_extent, lepa_extent, vmin=-2000, vmax=1000, cbar=False, alpha=0.9)
specials.plot(column='TYPE', categorical=True, ax=ax0, legend=True, cmap='rainbow', zorder=5)

ax1 = fig.add_subplot(gs[2, 0])
ax1 = mapExp.BackGround_2cmaps(fig, ax1, apia_extent, plt.cm.Blues_r, cmocean.cm.turbid, vmin=-2000, vmax=1000, cbar=False, alpha=0.9)
specials.plot(column='TYPE', categorical=True, ax=ax1, legend=False, cmap='rainbow', zorder=5)

plt.show()