Site Bathymetry
Contents
Site Bathymetry#
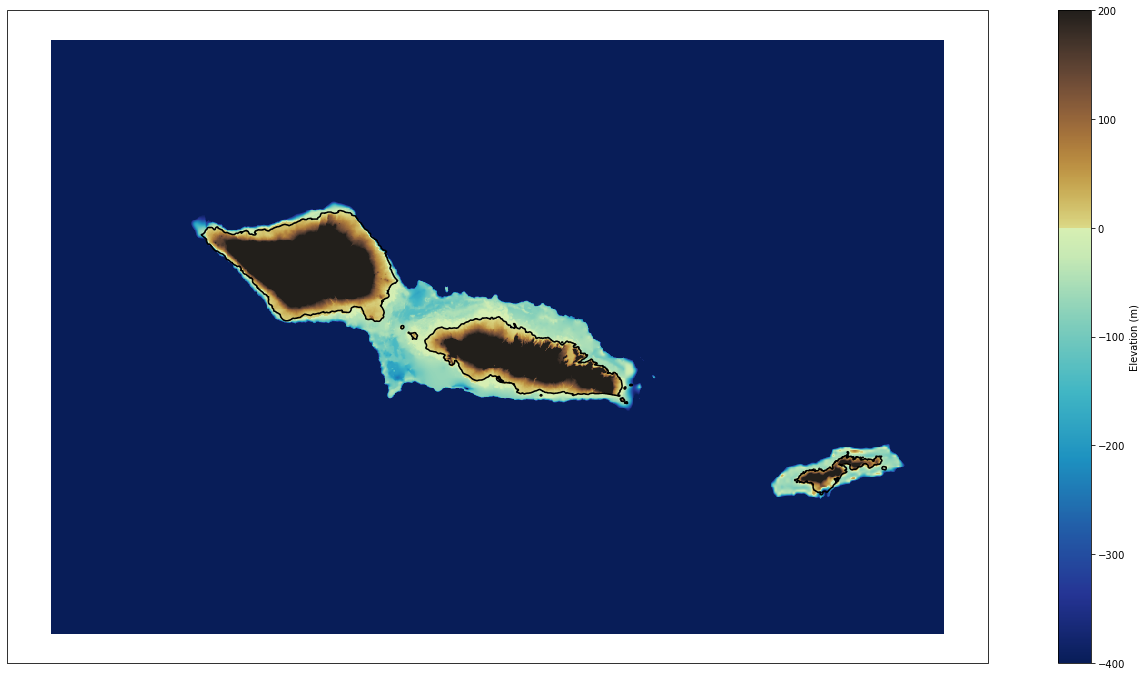
The final bathymetry for Samoa has been obtained from the combination of the following bathymetries with its own resolutions:
50m grid provided by NIWA covering Upolu and Savaii islands and obtained as explained here
250m grid provided by NIWA covering a larger area surrounding those islands
The data was interpolated to the same 0.0005 degree resolution, which corresponds to 50 m. Finally, the resultant combined bathymetry was processed to smoothen the boundaries in the transitions between the different datasets.
# common
import warnings
warnings.filterwarnings('ignore')
import os
import os.path as op
import sys
import pickle as pk

# pip
import xarray as xr
import numpy as np

# DEV: bluemath
sys.path.insert(0, op.join(op.abspath(''), '..', '..', '..', '..'))

# bluemath modules
from bluemath.plotting.nearshore import Plot_bathymetry
Database and site parameters#
# database
p_data = r'/media/administrador/HD2/SamoaTonga/data'
p_site = op.join(p_data, 'Samoa')

p_bathy = op.join(p_site, 'bathymetry')

# bathymetry file
p_bathyfile = op.join(p_bathy, 'samoa_smooth.nc')


# output files: SWAN grid depth and parameters
p_grid_depth = op.join(p_bathy, 'grid300_depth.pkl')
p_grid_param = op.join(p_bathy, 'grid300_params.pkl')
Load original bathymetry#
bathy = xr.open_dataset(p_bathyfile)

# sort y dimension
bathy = bathy.sortby(bathy.y, ascending=True)
print(bathy)

# plot bathymetry
Plot_bathymetry(
    bathy,
    min_z = -400, max_z=200,
    figsize = [25, 12],
);
<xarray.Dataset>
Dimensions:  (x: 982, y: 653)
Coordinates:
  * y        (y) float64 -14.83 -14.83 -14.83 -14.82 ... -12.88 -12.88 -12.88
  * x        (x) float64 186.7 186.7 186.7 186.7 ... 189.6 189.6 189.6 189.6
Data variables:
    z        (y, x) float64 ...
Define region and resolution#
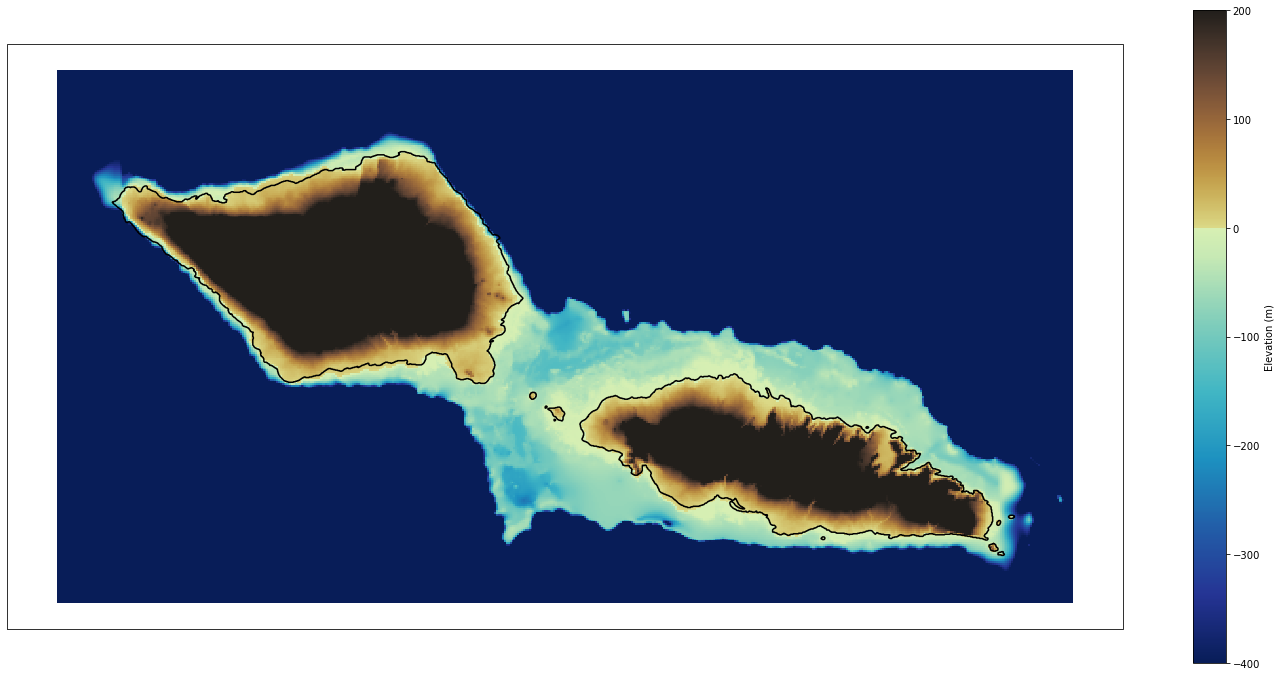
This is the region that we will use to run the SWAN model both for the waves and the wind
# Cutting area
region = [-172.92+360, -171.32+360,  -14.15, -13.31]  # [lon_min, lon_max, lat_min, lat_max]

bathy_cut = bathy.sel(
    x = slice(region[0], region[1]),
    y = slice(region[2], region[3]),
)
print(bathy_cut)
<xarray.Dataset>
Dimensions:  (x: 534, y: 280)
Coordinates:
  * y        (y) float64 -14.15 -14.15 -14.14 -14.14 ... -13.32 -13.32 -13.31
  * x        (x) float64 187.1 187.1 187.1 187.1 ... 188.7 188.7 188.7 188.7
Data variables:
    z        (y, x) float64 3.551e+03 3.534e+03 ... 4.832e+03 4.831e+03
Plotting
# plot bathymetry
Plot_bathymetry(
    bathy_cut,
    min_z = -400, max_z=200,
    figsize = [25, 12],
);
SWAN Pre-processing#
Here we calculate the bathymetric parameters needed to run the SWAN cases
[xpc, ypc] : Location of the lower left corner
[xlenc, ylenc] : Area length in x and y
[mxc, myc] : Number of grids in x and y
[res_x, res_y] : Resolution in x and y
# Origin
xpc = np.nanmin(bathy_cut.x)
ypc = np.nanmin(bathy_cut.y)

# Area
xlenc = np.nanmax(bathy_cut.x) - np.nanmin(bathy_cut.x)
ylenc = np.nanmax(bathy_cut.y) - np.nanmin(bathy_cut.y)

# Grid cells
mxc = len(bathy_cut.x) - 1
myc = len(bathy_cut.y) - 1

# Resolution
res_x = bathy_cut.x[1].values - bathy_cut.x[0].values
res_y = bathy_cut.y[1].values - bathy_cut.y[0].values
# SWAN main grid parameters
grid = {
    'xpc': xpc,      # x origin
    'ypc': ypc,      # y origin
    'alpc': 0,       # x-axis direction
    'xlenc': xlenc,  # grid length in x
    'ylenc': ylenc,  # grid length in y
    'mxc': mxc,      # number mesh x, una menos pq si no SWAN peta
    'myc': myc,      # number mesh y, una menos pq si no SWAN peta
    'dxinp': res_x,  # size mesh x (resolution in x)
    'dyinp': res_y,  # size mesh y (resolution in y)
}

print('Bathymetry parameters:')
for k in grid.keys():
    print('{0:6}: {1}'.format(k, grid[k]))
Bathymetry parameters:
xpc   : 187.08083499999807
ypc   : -14.149377999999974
alpc  : 0
xlenc : 1.5989999999924862
ylenc : 0.8370000000000317
mxc   : 533
myc   : 279
dxinp : 0.002999999999985903
dyinp : 0.0030000000000001137
Swan needs bathymetry to be flipped upside-down
depth = np.flipud(bathy_cut.z.values)
# store bathymetry data
pk.dump(grid, open(p_grid_param, "wb"))
pk.dump(depth, open(p_grid_depth, "wb"))