Validation of the synthetic waves and levels
Contents
15. Validation of the synthetic waves and levels#
inputs required:
historical wave conditions
emulator output - synthetic wave conditions
in this notebook:
Validation of the extreme distributions
Analysis of the DWT resposible of extreme TWL events (from the historical and synthetic datasets)
#!/usr/bin/env python
# -*- coding: utf-8 -*-

# common
import os
import os.path as op

# pip
import numpy as np
import xarray as xr
from datetime import datetime
import matplotlib.pyplot as plt

# DEV: override installed teslakit
import sys
sys.path.insert(0, op.join(os.path.abspath(''), '..','..', '..'))

# teslakit
from bluemath.teslakit.toolkit.extremes import peaks_over_threshold as POT
from bluemath.teslakit.util.time_operations import xds_reindex_daily

from bluemath.teslakit.plotting.extremes import Plot_ReturnPeriodValidation
from bluemath.teslakit.plotting.estela import Plot_DWTs_Probs
from bluemath.teslakit.plotting.wts import Plot_Probs_WT_WT
from bluemath.teslakit.plotting.outputs import Plot_LevelVariables_Histograms
15.1. Files and paths#
# project path
p_data = '/Users/albacid/Projects/TeslaKit.2.0_projects/SAMOA'

p_out = op.join(p_data,'OUTPUTS')

# historical inputs
hist_file = op.join(p_out,'hourly_his_TCs.nc')

n_sims = 100
# --------------------------------------
# Load complete hourly data for extremes analysis

# Historical
HIST_C_h = xr.open_dataset(hist_file)

# Simulation
for n in range(n_sims):
    SIM_C_h_n =  xr.open_dataset(op.join(p_out,'hourly_sim_TCs_{0:08d}.nc'.format(int(n))))

    if n==0:
        SIM_C_h = SIM_C_h_n.copy(deep=True)
    else:
        SIM_C_h = xr.concat([SIM_C_h, SIM_C_h_n], dim='n_sim') # QUITAR
15.2. AWL - Annual Maxima Calculation#
# def. some auxiliar function to select all dataset variables at vn max by groups

def grouped_max(ds, vn=None, dim=None):
    return ds.isel(**{dim: ds[vn].argmax(dim)})
# Historical AWL Annual Maxima

# remove nans before and after AWL
ix_nonan = np.squeeze(np.argwhere(~np.isnan(HIST_C_h['AWL'].values[:])))
HIST_C_nonan = HIST_C_h.isel(time = ix_nonan)

# calculate AWL annual maxima dataset
hist_AMax = HIST_C_nonan.groupby('time.year').apply(grouped_max, vn='AWL', dim='time')
# Simulation AWL Annual Maxima

# calculate AWL annual maxima dataset
#sim_AMax = SIM_C_h.groupby('time.year').apply(grouped_max, vn='AWL', dim='time')

sim_AMax = xr.concat([SIM_C_h.sel(n_sim=x).groupby('time.year').apply(grouped_max, vn='AWL', dim='time') for x in SIM_C_h.n_sim.values[:]], dim='n_sim')
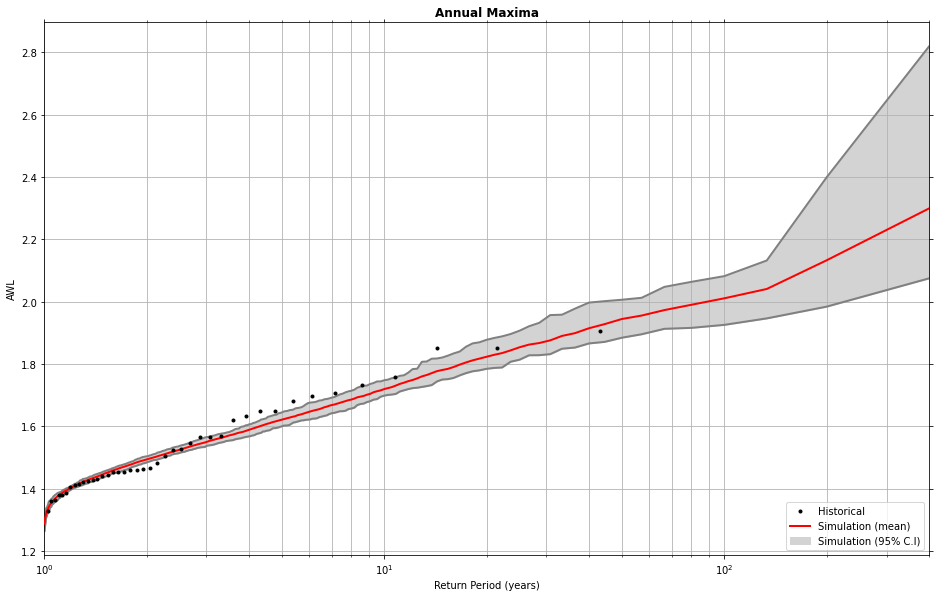
15.3. AWL - Annual Maxima Return Period#
# For estimation of return periods, transform the 80yr - 100sims into: 400yr - 20sims
sim_AMax_rt = xr.Dataset({'AWL': (['n_sim', 'year'],  np.reshape(sim_AMax.AWL.values, (20,400))),
                          'Hs': (['n_sim', 'year'],  np.reshape(sim_AMax.Hs.values, (20,400))),
                          'Tp': (['n_sim', 'year'],  np.reshape(sim_AMax.Tp.values, (20,400))),
                         },

                    coords={'year': ('year', np.arange(2020,2020+400)),
                           })
# AWL Annual Maxima Return Period (historical vs. simulations)

Plot_ReturnPeriodValidation(hist_AMax['AWL'], sim_AMax_rt['AWL']);
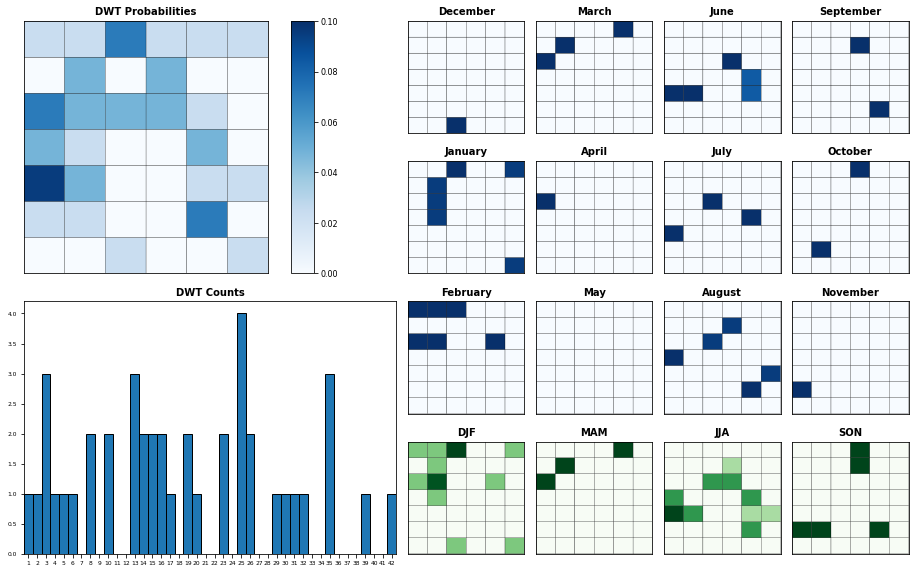
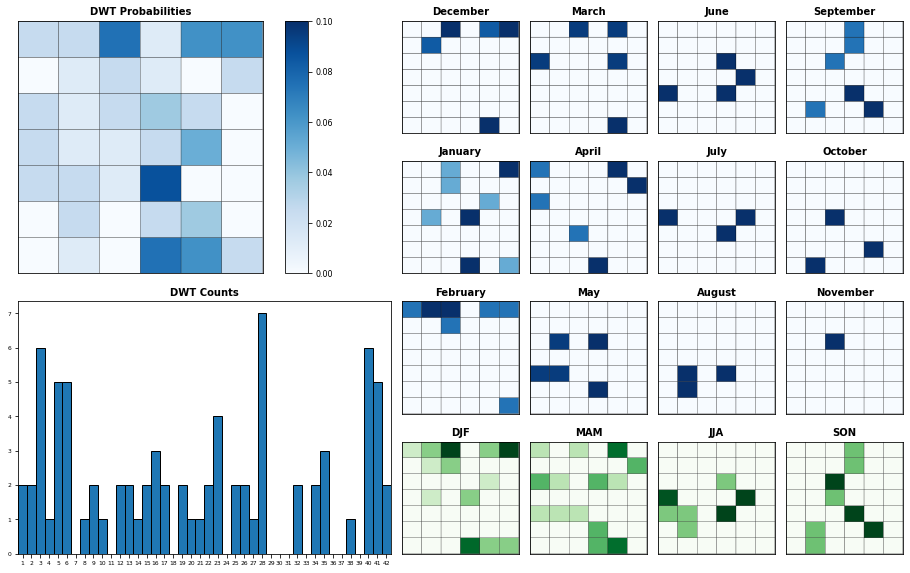
15.4. AWL - Annual Maxima Probabilistic Plots#
# Probabilistic plots parameters

n_clusters_AWT = 6    # number of AWT clusters
n_clusters_DWT = 42   # number of DWT clusters

# Select one simulation DWTs - WAVEs simulation
n_sim = 0
sim_AMax_n = sim_AMax.sel(n_sim=0)
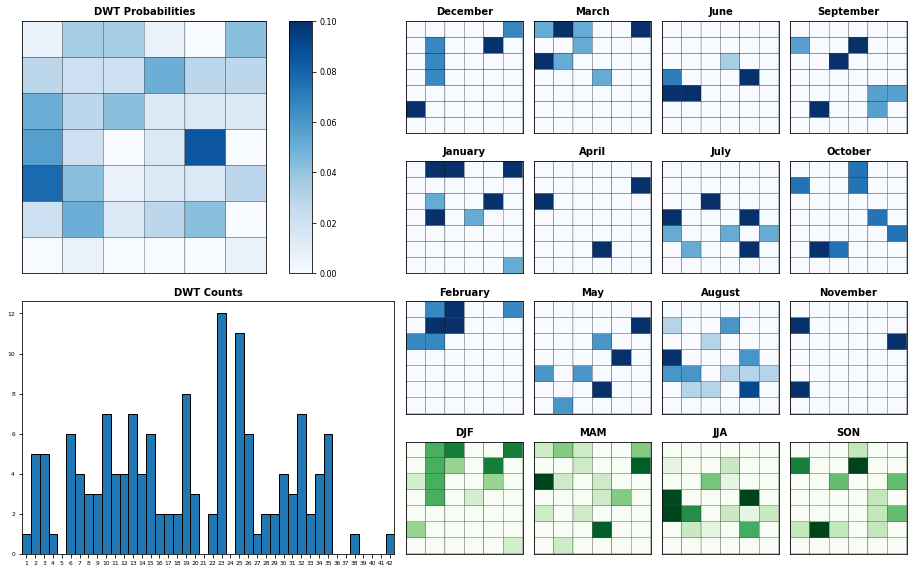
# Plot Annual Maxima DWT probabilities by month
# Historical
Plot_DWTs_Probs(hist_AMax['DWT'].values, hist_AMax.time.values, n_clusters_DWT);
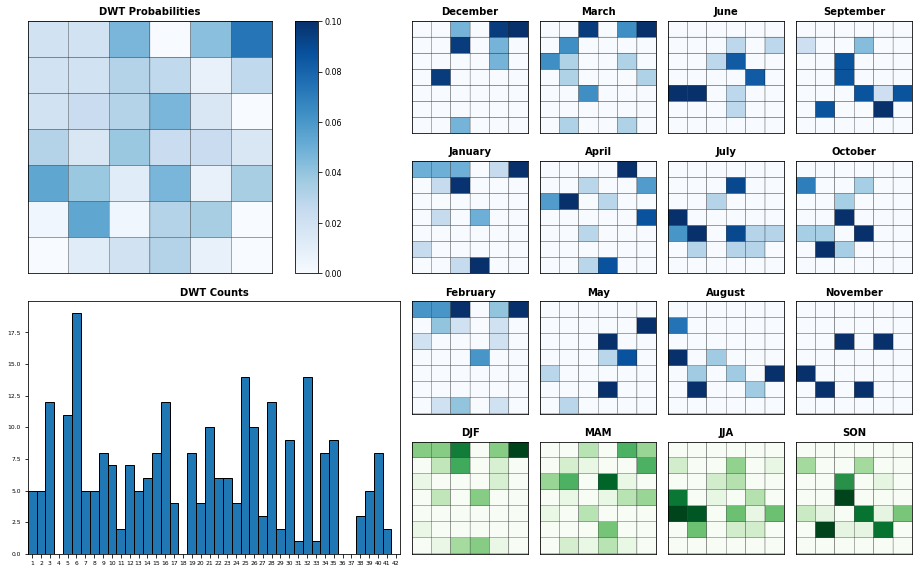
# Simulation
Plot_DWTs_Probs(sim_AMax_n['DWT'].values, sim_AMax_n.time.values, n_clusters_DWT);
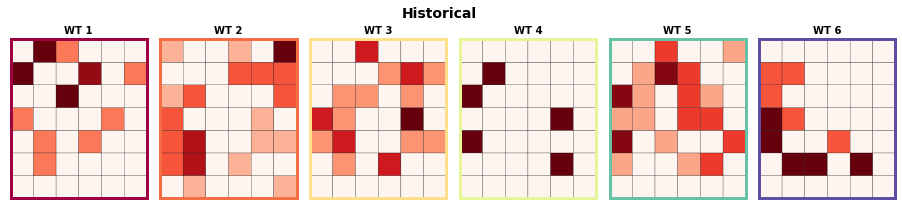
# Plot Annual Maxima AWTs/DWTs Probabilities
# Historical
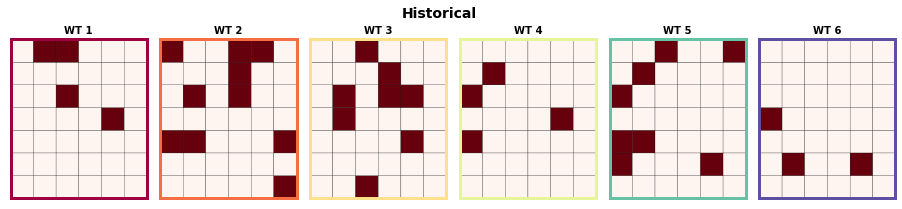
Plot_Probs_WT_WT(
hist_AMax['AWT'].values - 1, hist_AMax['DWT'].values[:] - 1,
n_clusters_AWT, n_clusters_DWT, wt_colors=True, ttl = 'Historical',
);
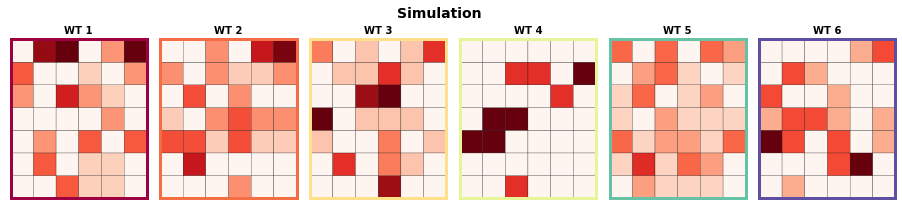
# Simulation
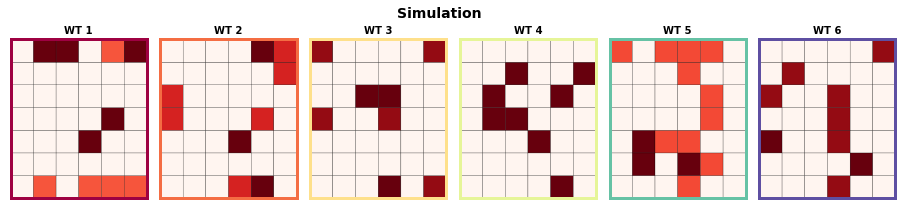
Plot_Probs_WT_WT(
sim_AMax_n['AWT'].values[:] - 1, sim_AMax_n['DWT'].values[:] - 1,
n_clusters_AWT, n_clusters_DWT, wt_colors=True, ttl = 'Simulation',
);
15.5. AWL - Peaks Over Threshold Calculation#
# POT  plots parameters

n_clusters_AWT = 6    # number of AWT clusters
n_clusters_DWT = 42   # number of DWT clusters

# Select one simulation DWTs - WAVEs simulation
n_sim = 0
SIM_C_h_n = SIM_C_h.sel(n_sim=0)


# TODO: update POT to work with hourly data
_, ix = np.unique(SIM_C_h_n['time'], return_index=True)
SIM_C_h_n = SIM_C_h_n.isel(time=ix)

# Parse data to daily
HIST_C_d = xds_reindex_daily(HIST_C_nonan)  # TODO: check possible bug if this puts NAN inside AWL data
SIM_C_d_n = xds_reindex_daily(SIM_C_h_n)

HIST_C_d = HIST_C_d.where(~np.isnan(HIST_C_d.Tp), drop=True)
SIM_C_d_n = SIM_C_d_n.where(~np.isnan(SIM_C_d_n.Tp), drop=True)
# Get independent event peaks (99 percentile)
# Historical
times_POT = POT(HIST_C_d.isel(time=slice(1,-1)), 'AWL', 99).time  # TODO: check possible awl nan bug
hist_POT = HIST_C_d.sel(time = times_POT)

# Simulation
times_POT = POT(SIM_C_d_n, 'AWL', 99).time
sim_POT = SIM_C_d_n.sel(time = times_POT)
15.6. AWL - Peaks Over Threshold Probabilistic Plots#
# Plot Peaks Over Threshold DWT probabilities by month

# Historical
Plot_DWTs_Probs(hist_POT['DWT'].values, hist_POT.time.values, n_clusters_DWT);

# Simulation
Plot_DWTs_Probs(sim_POT['DWT'].values, sim_POT.time.values, n_clusters_DWT);
# Plot Peaks Over Threshold AWTs/DWTs Probabilities

# Historical
Plot_Probs_WT_WT(
    hist_POT['AWT'].values - 1, hist_POT['DWT'].values[:] - 1,
    n_clusters_AWT, n_clusters_DWT, wt_colors=True, ttl = 'Historical',
);

# Simulation
Plot_Probs_WT_WT(
    sim_POT['AWT'].values[:] - 1, sim_POT['DWT'].values[:] - 1,
    n_clusters_AWT, n_clusters_DWT, wt_colors=True, ttl = 'Simulation',
);
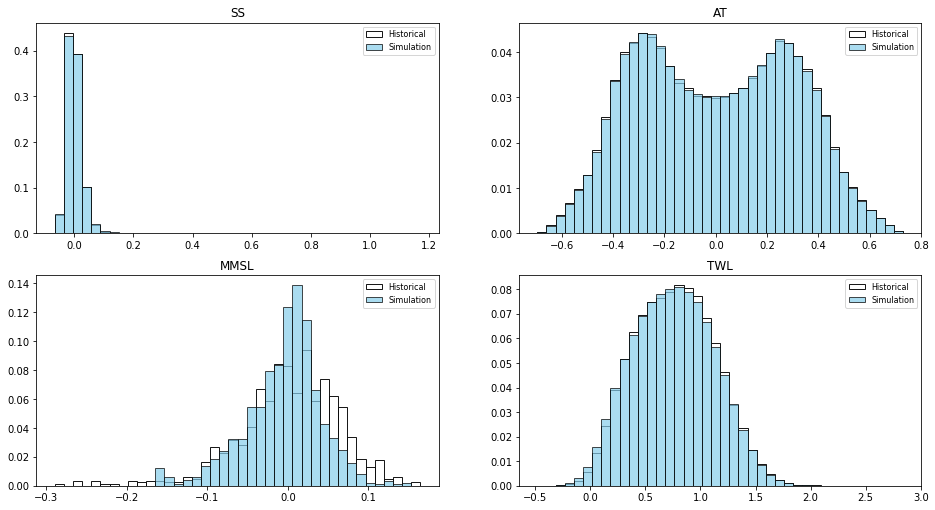
15.7. Level Variables - Histograms#
# Plot level, AT, MMSL and TWL histogram comparison between historical and simulated data
Plot_LevelVariables_Histograms(HIST_C_h, SIM_C_h.sel(n_sim = 0), vars = ['SS', 'AT', 'MMSL', 'TWL']);
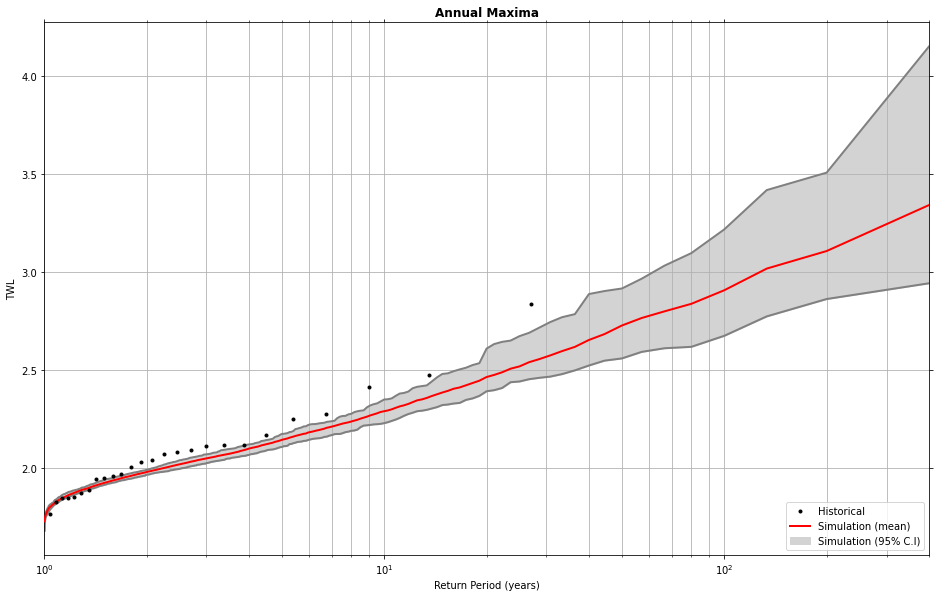
15.8. TWL - Annual Maxima#
# Plot TWL annual maxima

# calculate Annual Maxima values for historical and simulated data
hist_A = HIST_C_h['TWL'].groupby('time.year').max(dim='time')
sim_A = SIM_C_h['TWL'].groupby('time.year').max(dim='time')

# Return Period historical vs. simulations
Plot_ReturnPeriodValidation(hist_A, sim_A);
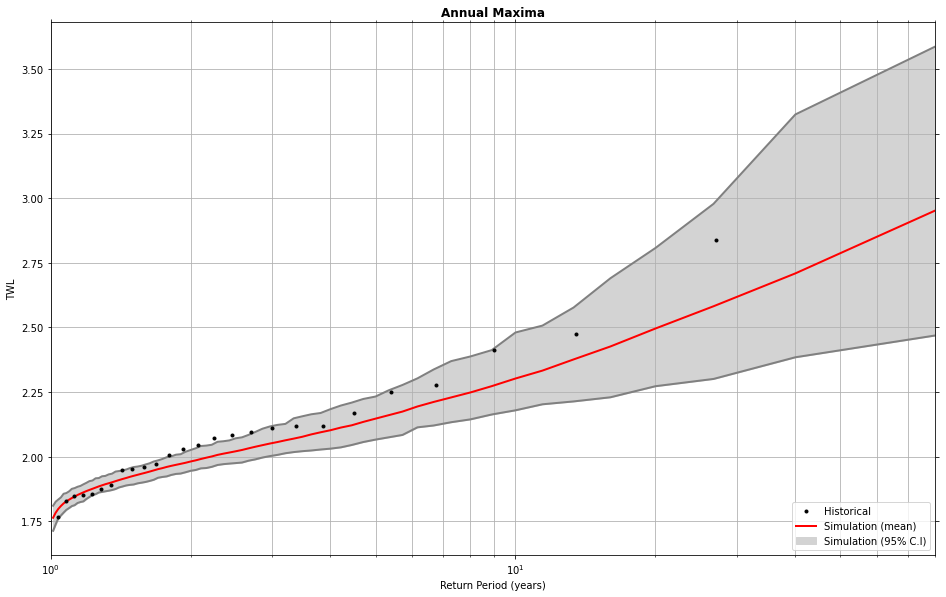
sim_TWL_AMax_rt = xr.Dataset({'TWL': (['n_sim', 'year'],  np.reshape(sim_A, (20,400))),},
                    coords={'year': ('year', np.arange(2020,2020+400)),})


# Return Period historical vs. simulations
Plot_ReturnPeriodValidation(hist_A, sim_TWL_AMax_rt['TWL']);