Tsunami Impact Damage for Samoa Islands
Contents
Tsunami Impact Damage for Samoa Islands#
# sys
import os
import os.path as op
import sys
# basic
import xarray as xr
import numpy as np
import pandas as pd
import matplotlib.colors as mcolors
import matplotlib.pyplot as plt
from matplotlib.gridspec import GridSpec
from keplergl import KeplerGl
import json
# geospatial
import rasterio
import rioxarray
import contextily as ctx
from shapely.geometry import mapping
# dependencies
sys.path.insert(0, op.join(os.getcwd(), 'lib'))
from lib import *
p_main = os.getcwd()
p_hzd = op.join(p_main, 'data', 'Samoa_latest-2009_TsunamiForecast.tif')
p_exe = op.join(p_main, 'riskscape', 'resources', 'bin', 'riskscape')
p_dem_savaii = op.join(p_main, 'data', 'savaii_5m.nc')
p_dem_upolu = op.join(p_main, 'data', 'upolu_5m.nc')
p_config_pol = op.join(p_main, 'data', 'config_dmg_polygon_samoa.json')
p_poly = op.join(p_main, 'data', 'samoa_polygon.shp')
code_utm = 32702
apia_extent = [409500, 425500, 8467000, 8474000]
hzd_tsu = rioxarray.open_rasterio(p_hzd).drop(['band', 'spatial_ref']).squeeze().rio.write_crs('epsg:{0}'.format(code_utm))
ds_samoa = hzd_tsu.where(hzd_tsu != hzd_tsu._FillValue)
dem_savaii = xr.open_dataset(p_dem_savaii).rio.write_crs('epsg:{0}'.format(code_utm)).isel(x=slice(None, None, 20), y=slice(None, None, 20))
dem_upolu = xr.open_dataset(p_dem_upolu).rio.write_crs('epsg:{0}'.format(code_utm)).isel(x=slice(None, None, 20), y=slice(None, None, 20))
poly = gpd.read_file(p_poly)
hzd_tsu = hzd_tsu.where(hzd_tsu != hzd_tsu._FillValue)
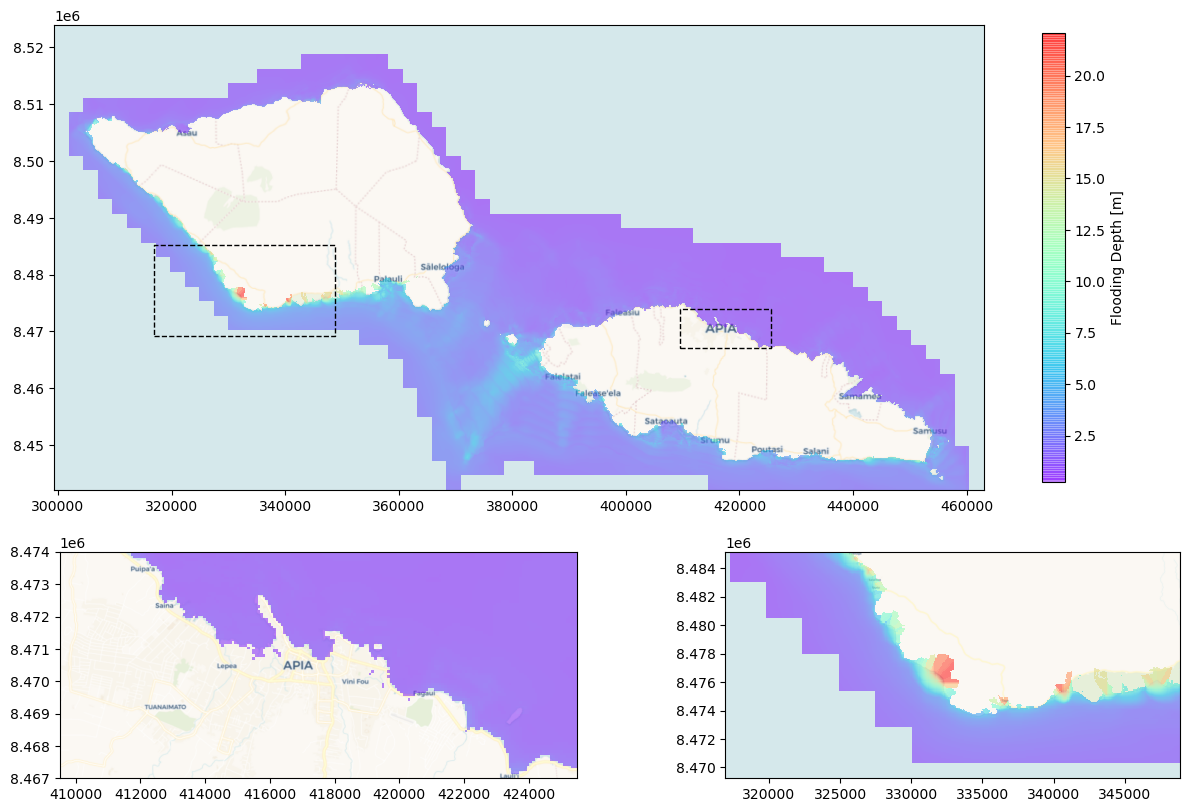
Hazard#
ids = np.unravel_index(np.nanargmax(ds_samoa.values), ds_samoa.values.shape)
ds_samoa_cut = ds_samoa.isel(x=slice(ids[1]-200, ids[1]+200), y=slice(ids[0]-100, ids[0]+100))
ext = [ds_samoa_cut.x.min(), ds_samoa_cut.x.max(), ds_samoa_cut.y.min(), ds_samoa_cut.y.max()]
fig = plt.figure(constrained_layout=False, figsize=(15,10))
gs = GridSpec(3, 2, figure=fig)
ax0 = fig.add_subplot(gs[0:2, :])
im = ax0.pcolorfast(ds_samoa.x, ds_samoa.y, ds_samoa, cmap='rainbow', zorder=2, alpha=0.5)
ctx.add_basemap(ax0, zoom = 10, crs='epsg:{0}'.format(code_utm), source=ctx.providers.CartoDB.Voyager, attribution=False, zorder=1)
ax0.plot([apia_extent[0], apia_extent[1], apia_extent[1], apia_extent[0], apia_extent[0]], [apia_extent[2], apia_extent[2], apia_extent[3], apia_extent[3], apia_extent[2]], linewidth=1, c='k', linestyle='--', zorder=6)
ax0.plot([ext[0], ext[1], ext[1], ext[0], ext[0]], [ext[2], ext[2], ext[3], ext[3], ext[2]], linewidth=1, c='k', linestyle='--', zorder=6)
ax1 = fig.add_subplot(gs[2, 0])
ax1.pcolorfast(ds_samoa.x, ds_samoa.y, ds_samoa, cmap='rainbow', zorder=2, alpha=0.5)
ctx.add_basemap(ax1, zoom = 13, crs='epsg:{0}'.format(code_utm), source=ctx.providers.CartoDB.Voyager, attribution=False, zorder=1)
ax1.set_xlim([apia_extent[0], apia_extent[1]])
ax1.set_ylim([apia_extent[2], apia_extent[3]])
ax2 = fig.add_subplot(gs[2, 1])
ax2.pcolorfast(ds_samoa_cut.x, ds_samoa_cut.y, ds_samoa_cut, cmap='rainbow', zorder=2, alpha=0.5)
ctx.add_basemap(ax2, zoom = 13, crs='epsg:{0}'.format(code_utm), source=ctx.providers.CartoDB.Voyager, attribution=False, zorder=1)
fig.colorbar(im, ax=ax0, shrink=0.9, label='Flooding Depth [m]')
plt.show()

RiskScape: Intersect Hazard & Damage Functions#
models = ['Landcrops_coastal_dam', 'Build_coastal_dam', 'Especials_coastal_dam', 'People_coastal_dam', 'Roads_coastal_dam']
sites = ['savaii', 'upolu']
for site in sites:
print('Running Riskscape in {0}'.format(site))
p_out = op.join(p_main, 'riskscape', 'io_{0}'.format(site))
os.chdir(p_out)
for model in models:
path_output = op.join(p_out, 'results', model)
list = [p_exe, ' model run ', model, ' --parameter ' '"input-hazards.layer=' + p_hzd + '" ', ' --output ', path_output, ' -r ']
to_run = ''.join(list)
stream = os.popen(to_run)
output = stream.read()
Running Riskscape in savaii
Running Riskscape in upolu
Map Tsunami Damage#
path_sv = p_out = op.join(p_main, 'riskscape', 'io_savaii', 'results')
path_up = p_out = op.join(p_main, 'riskscape', 'io_upolu', 'results')
land_dmg_sv, build_dmg_sv, spec_dmg_sv, people_dmg_sv, road_dmg_sv, ds_damage_sv = read_shp_dmg(path_sv, models, dem_savaii)
land_dmg_up, build_dmg_up, spec_dmg_up, people_dmg_up, road_dmg_up, ds_damage_up = read_shp_dmg(path_up, models, dem_upolu)
land_dmg = pd.concat([land_dmg_sv, land_dmg_up])
build_dmg = pd.concat([build_dmg_sv, build_dmg_up])
spec_dmg = spec_dmg_up
road_dmg = pd.concat([road_dmg_sv, road_dmg_up])
people_dmg = pd.concat([people_dmg_sv, people_dmg_up])
a_file = open(p_config_pol, "rb")
config = json.load(a_file)
Damage to Assets#
hzd_tsu_land = hzd_tsu.rio.clip(poly.buffer(100).geometry.apply(mapping), poly.crs)
hzd_tsu_land = hzd_tsu_land.rio.reproject('epsg:{0}'.format(4326))
hzd_tsu_land = hzd_tsu_land.where(hzd_tsu_land != hzd_tsu_land._FillValue)
df_hzd_84 = hzd_tsu_land.drop('spatial_ref').to_dataframe(name='z').reset_index().rename(columns={'x': 'Lon', 'y':'Lat'}).dropna()
# Load Hazard - flooding depth
map_1 = KeplerGl(height=700, data={"Flooding Hazard [m]":df_hzd_84}, config=config, show_docs=False)
# Load Damage - Buildings, Land and Roads
map_1.add_data(data=build_dmg, name='Buildings Damage [2010 USD $]')
map_1.add_data(data=land_dmg, name='Land Crops Damage [2010 USD $]')
map_1.add_data(data=road_dmg, name='Roads Damage [2010 USD $]')
map_1.add_data(data=spec_dmg, name='Specials Damage [2010 USD $]')
map_1.add_data(data=people_dmg, name='People Damage')
map_1
map_1.save_to_html(file_name='Tsunami_2009_Samoa_Damage.html')
Map saved to Tsunami_2009_Samoa_Damage.html!
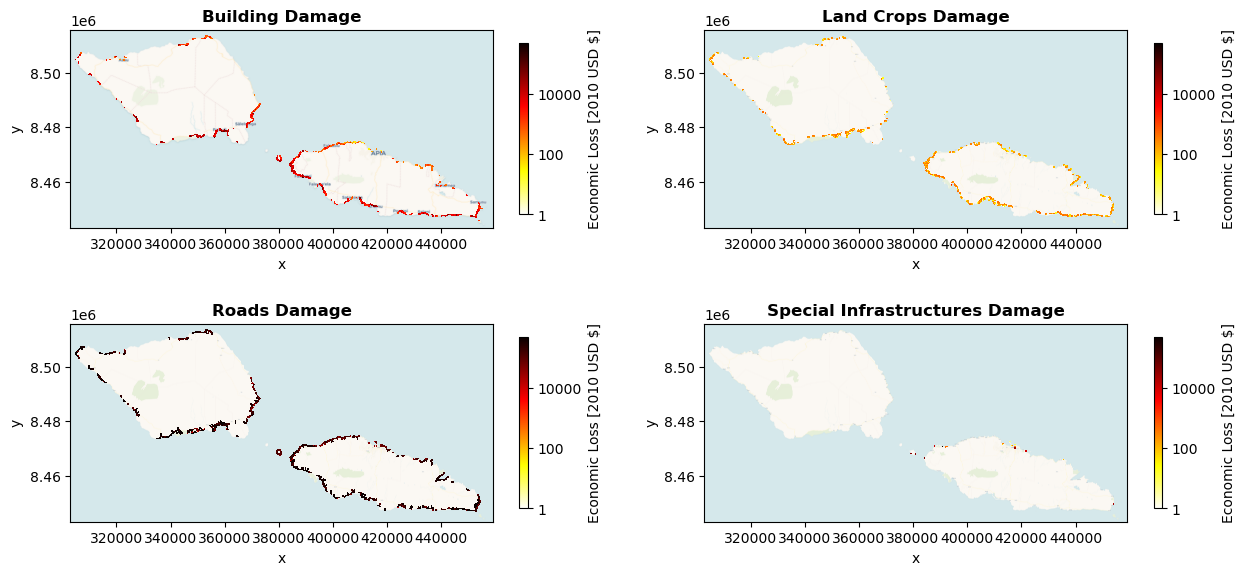
Damage to assets in 100 x 100 m raster cells#
ds_damage = xr.merge([ds_damage_sv, ds_damage_up])
fig = plt.figure(constrained_layout=False, figsize=(15,7))
gs = GridSpec(2, 2, figure=fig)
ax0 = fig.add_subplot(gs[0, 0])
im0 = ds_damage.Loss_build.where(ds_damage.Loss_build > 0).plot(ax=ax0, x='x', cmap='hot_r', add_colorbar=False, norm=mcolors.LogNorm(), vmin=1, vmax=500000, zorder=5)
ctx.add_basemap(ax0, zoom = 10, crs='epsg:{0}'.format(code_utm), source=ctx.providers.CartoDB.Voyager, attribution=False, zorder=1)
fig.colorbar(im0, ax=ax0, shrink=0.7, label='Economic Loss [2010 USD $]', format='%d')
ax0.set_title('Building Damage', fontweight='bold')
ax1 = fig.add_subplot(gs[0, 1])
im1 = ds_damage.Loss_land.where(ds_damage.Loss_land > 0).plot(ax=ax1, x='x', cmap='hot_r', add_colorbar=False, norm=mcolors.LogNorm(), vmin=1, vmax=500000, zorder=5)
ctx.add_basemap(ax1, zoom = 13, crs='epsg:{0}'.format(code_utm), source=ctx.providers.CartoDB.Voyager, attribution=False, zorder=1)
fig.colorbar(im1, ax=ax1, shrink=0.7, label='Economic Loss [2010 USD $]', format='%d')
ax1.set_title('Land Crops Damage', fontweight='bold')
ax2 = fig.add_subplot(gs[1, 0])
im2 = ds_damage.Loss_roads.where(ds_damage.Loss_roads > 0).plot(ax=ax2, x='x', cmap='hot_r', add_colorbar=False, norm=mcolors.LogNorm(), vmin=1, vmax=500000, zorder=5)
ctx.add_basemap(ax2, zoom = 13, crs='epsg:{0}'.format(code_utm), source=ctx.providers.CartoDB.Voyager, attribution=False, zorder=1)
fig.colorbar(im2, ax=ax2, shrink=0.7, label='Economic Loss [2010 USD $]', format='%d')
ax2.set_title('Roads Damage', fontweight='bold')
ax3 = fig.add_subplot(gs[1, 1])
im3 = ds_damage.Loss_spec.where(ds_damage.Loss_spec > 0).plot(ax=ax3, x='x', cmap='hot_r', add_colorbar=False, norm=mcolors.LogNorm(), vmin=1, vmax=500000, zorder=5)
ctx.add_basemap(ax3, zoom = 13, crs='epsg:{0}'.format(code_utm), source=ctx.providers.CartoDB.Voyager, attribution=False, zorder=1)
fig.colorbar(im3, ax=ax3, shrink=0.7, label='Economic Loss [2010 USD $]', format='%d')
ax3.set_title('Special Infrastructures Damage', fontweight='bold')
plt.show()

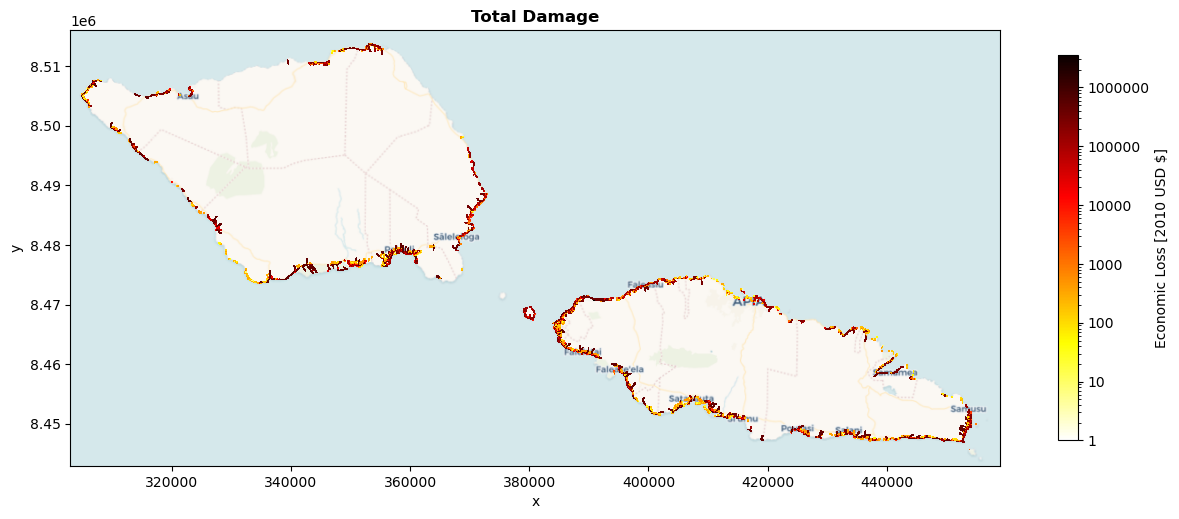
Aggregated Damage in 100 x 100 m raster cells#
ds_damage['Loss'] = ds_damage['Loss_build'] + ds_damage['Loss_land'] + ds_damage['Loss_roads'] + ds_damage['Loss_spec']
fig = plt.figure(constrained_layout=False, figsize=(15,10))
gs = GridSpec(1, 1, figure=fig)
ax0 = fig.add_subplot(gs[0, 0])
im0 = ds_damage.Loss.where(ds_damage.Loss > 0).plot(ax=ax0, x='x', cmap='hot_r', add_colorbar=False, norm=mcolors.LogNorm(), vmin=1, vmax=3500000, zorder=5)
ctx.add_basemap(ax0, zoom = 10, crs='epsg:{0}'.format(code_utm), source=ctx.providers.CartoDB.Voyager, attribution=False, zorder=1)
fig.colorbar(im0, ax=ax0, shrink=0.5, label='Economic Loss [2010 USD $]', format='%d')
ax0.set_title('Total Damage', fontweight='bold')
plt.show()


