TC Winds-ReForecast in Upolu
Contents
TC Winds-ReForecast in Upolu#
This way, we have created a library of cases, with more than 7000 events, that allow for any new forecasted event, and based on the tracks from the Joint Typhon Warning Center, (JTWC), the winds that these tracks might produce are simulated with Holland’s empirical model at the ERA-5 resolution, then these forecasted winds are compared with the library of cases, choosing the most similar ones to reconstruct the high resolution winds based on k-nearest neighbors.
Forecast
In this section we will produce the probabilistic assessment of WINDS for the forecast information of the TC AMOS issued some days previous to its arrival
import os
import os.path as op
import sys
import warnings
warnings.filterwarnings('ignore')

import pandas as pd
import numpy as np
import xarray as xr
import rioxarray as rio
from pyproj import CRS
from sklearn.cluster import KMeans
from scipy.stats import qmc
from shapely.geometry import Point, Polygon
from matplotlib.colors import ListedColormap
from cartopy.feature import ShapelyFeature
from cartopy.io.shapereader import Reader

sys.path.insert(0, op.join(op.abspath(''), '..', '..', '..'))

# bluemath modules
from bluemath.winds.graffiti_rain import *
from bluemath.winds.plots.common import custom_cmap
from bluemath.winds.tc_forecast import Load_TCs_Warning,Plot_tracks,Plot_Density_Forecast_Tracks
from bluemath.winds.winds import windy
from bluemath.winds.plots.probs import plot_prob_assessment

# this is to allow plots to be centered
from IPython.core.display import HTML
from IPython.display import HTML
HTML("""
<style>
.output_png {
    display: table-cell;
    text-align: center;
    vertical-align: middle;
}
</style>
""")
# database
p_data = r'/media/administrator/HD2/SamoaTonga/data'
site = 'Upolu'
p_site = op.join(p_data, site)

# deliverable folder
p_deliv = op.join(p_site, 'd10_wind_damage')

# path database WRF
p_db = '/media/administrator/HD1/DATABASES'
p_db_winds = op.join(p_db, 'WRF_Wind')
# ERA5
p_db_era = op.join(p_db_winds, 'era5_data', f'era5_data_{site}.nc')
# high resolution
p_db_hr = op.join(p_db_winds, 'hr_wind_data', f'HR_{site}_ALL.nc')

# coast path
p_coast = op.join(p_data, 'gshhg-shp-2.3.7', 'GSHHS_shp', 'f', 'GSHHS_f_L1.shp')

# forecast gita files
name_f_file = 'ash202016_amos_aids.dat'
path_tc_rf = os.path.join(p_deliv, name_f_file)

n, tc_name = 166, 'amos' # AMOS
p_track = os.path.join(p_deliv,'sp_{0}.nc'.format(n))
p_f_tracks_processed = os.path.join(p_deliv, 'Processed_tracks_Selected_' + name_f_file[:-4]+'.nc')

# output files
p_hr_tc = op.join(p_deliv, 'hr_AMOS_tracks.nc')
p_vortex_tc = op.join(p_deliv, 'vortex_AMOS_tracks.nc')
p_final_track_tif = op.join(p_deliv, 'hr_FINAL_track_AMOS_lonlat.tif')
p_final_track_tif_utm = op.join(p_deliv, 'hr_FINAL_track_AMOS_utm.tif')
p_final_track_tif_utm_risk = op.join(p_data, 'riskscape_projects',
                                     site, 'data', 'hr_FINAL_track_AMOS_utm_risk.tif')
# don't change this code below
if site=='Tongatapu':
    site_center = (-175.19+360,-21.16)
elif site=='Savaii':
    site_center = (-172.40+360,-13.65)
elif site=='Upolu':
    site_center = (-171.78+360,-13.92)
radius = 0.15
site_shape = Point(*site_center).buffer(radius)
# domain_shape = saff.scale(domain_shape,1,0.5)
# load the high-resolution coastline for the plots
coast_full = ShapelyFeature(
    Reader(p_coast).geometries(),
    ccrs.PlateCarree(),edgecolor='black')
cmap_probs = ListedColormap([
    'forestgreen','limegreen','chartreuse','yellow','gold',
    'goldenrod','darkorange','crimson','brown','darkmagenta'])
TC Tracks#
Track warning predictions
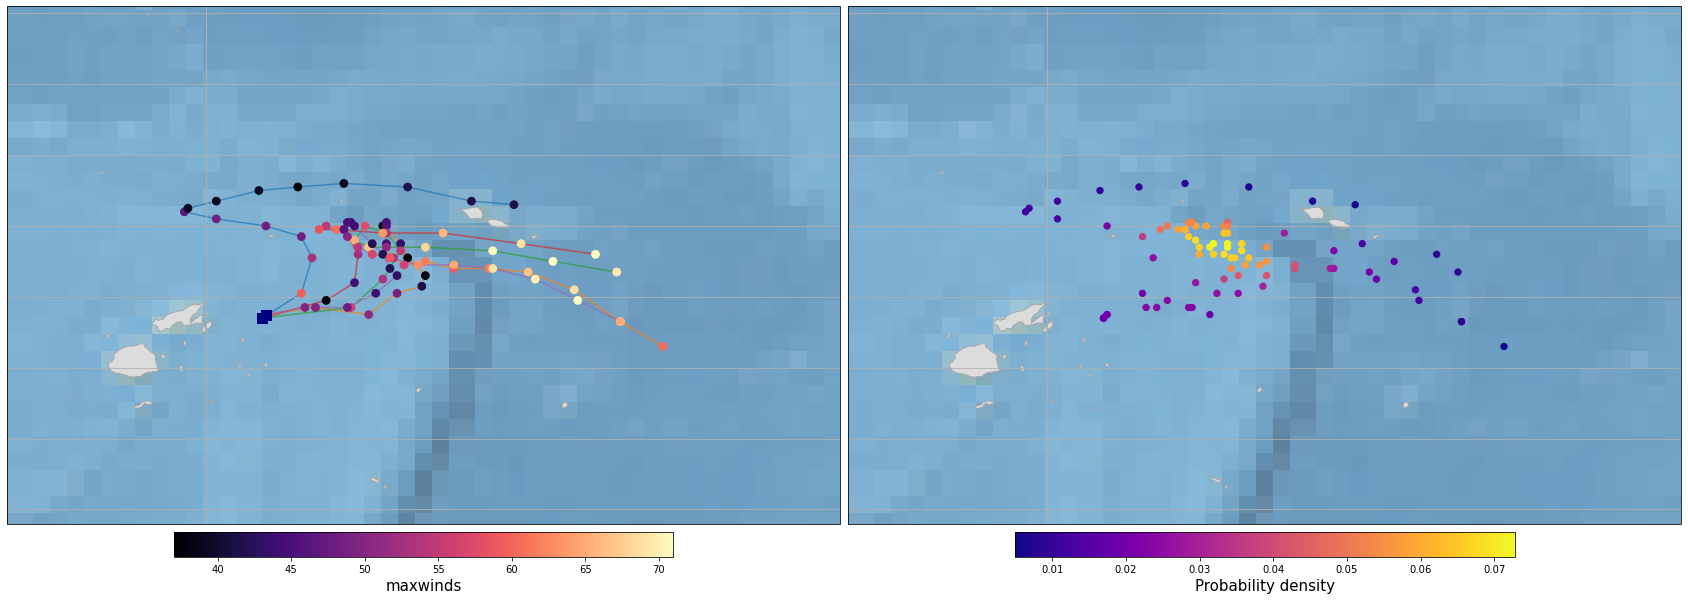
For a given historic track, at any given day, the warning track predictions issued by different available agencies are collected!!
tco = xr.open_dataset(p_track)
tc = process_tc_file(tco)
tc = tc.isel(date_time=slice(150,385))
fig_tc = Plot_track(tc, figsize=[20,10], cmap='jet_r', m_size=10)
TC: AMOS, starting day 2016-04-17
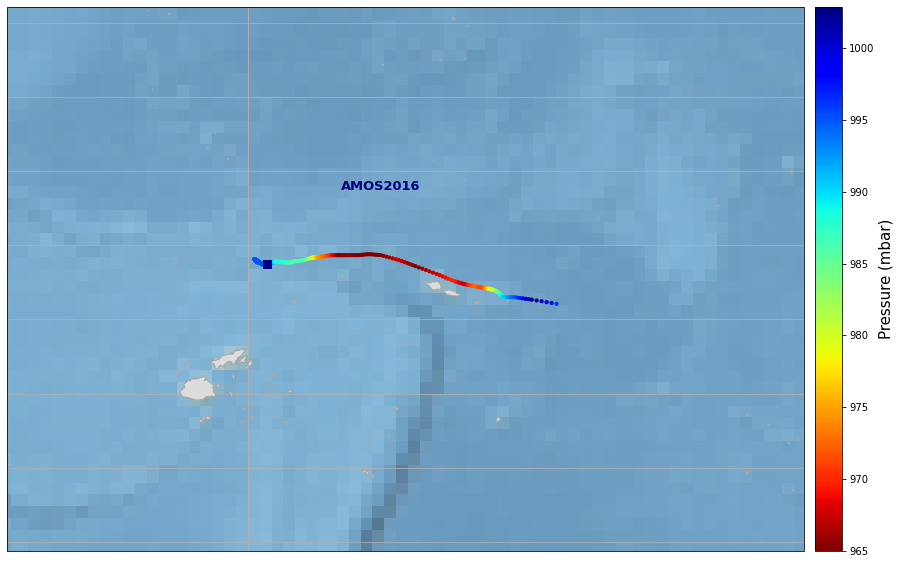
t = '2016-04-17T12:00'
TRACKS = Load_TCs_Warning(path_tc_rf, time=t)
print('Available Agencies')
print(TRACKS.Agency.values)
Available Agencies
[' CARQ' ' AEMN' ' AHNI' ' AVNI' ' AVNO' ' AVS1' ' AVS5' ' CLIM' ' CLIP'
 ' CLSW' ' CMES' ' CMSD' ' CONW' ' COTC' ' CTCX' ' EEM4' ' EGR2' ' FBAM'
 ' GFDI' ' GFDL' ' GFDN' ' GFDT' ' GFNI' ' GFS1' ' GFS5' ' GFTI' ' GHMI'
 ' GHTI' ' GPMI' ' GPMN' ' HHFI' ' HPAC' ' HWFI' ' HWRF' ' JAVI' ' JJG2'
 ' JNVI' ' JUK2' ' LGEA' ' MBAM' ' N022' ' N032' ' N052' ' N062' ' N072'
 ' N082' ' N102' ' N112' ' N142' ' N152' ' N162' ' N182' ' N192' ' N202'
 ' NG01' ' NG02' ' NG03' ' NG04' ' NG06' ' NG07' ' NG08' ' NG09' ' NG10'
 ' NG11' ' NG12' ' NG14' ' NG15' ' NG17' ' NG18' ' NG19' ' NG20' ' NVG2'
 ' RVCN' ' S5XX' ' S5YY' ' SBAM' ' SHIA' ' ST5D' ' UKS1' ' UKS5' ' WANI'
 ' XTRP' ' EGRR' ' JNVG' ' JAVN' ' JJGS']
Tracks Selection#
ags_sel = list(TRACKS.Agency.values[[3,19,27,28,29]])
# ags_sel = [' AVNI', ' NVGI', ' JTWC', ' NVGM',' JAVI' ]
c,ia,ib=np.intersect1d(TRACKS.Agency.values, ags_sel, return_indices=True)
print('Total number of tracks: ' + str(len(ia)))
print('Agencies from selection list available : ' + str(np.array(ags_sel)[ib]))
TRACKS=TRACKS.isel(track=ia)
TRACKS['Index']=(('track'), ia)
TRACKS.to_netcdf(p_f_tracks_processed)
nt=len(TRACKS.track)
Total number of tracks: 5
Agencies from selection list available : [' AVNI' ' GFDL' ' GHTI' ' GPMI' ' GPMN']
fig = plt.figure(figsize=[30,15]) #30,20
gs = gridspec.GridSpec(1,2,hspace=0.01,wspace=0.01)
ax1 = fig.add_subplot(gs[0],projection = ccrs.PlateCarree(central_longitude=190))
_,_,area=Plot_tracks(TRACKS, var='maxwinds', ax=ax1, fig=fig)
ax2 = fig.add_subplot(gs[1],projection = ccrs.PlateCarree(central_longitude=190))
Plot_Density_Forecast_Tracks(TRACKS, ax=ax2, fig=fig)
(<Figure size 2160x1080 with 4 Axes>,
 <GeoAxesSubplot:>,
 [174.4, 197.9, -22.4, -7.800000000000001])
area_extent=[182, 194, -6.6, -19.1]
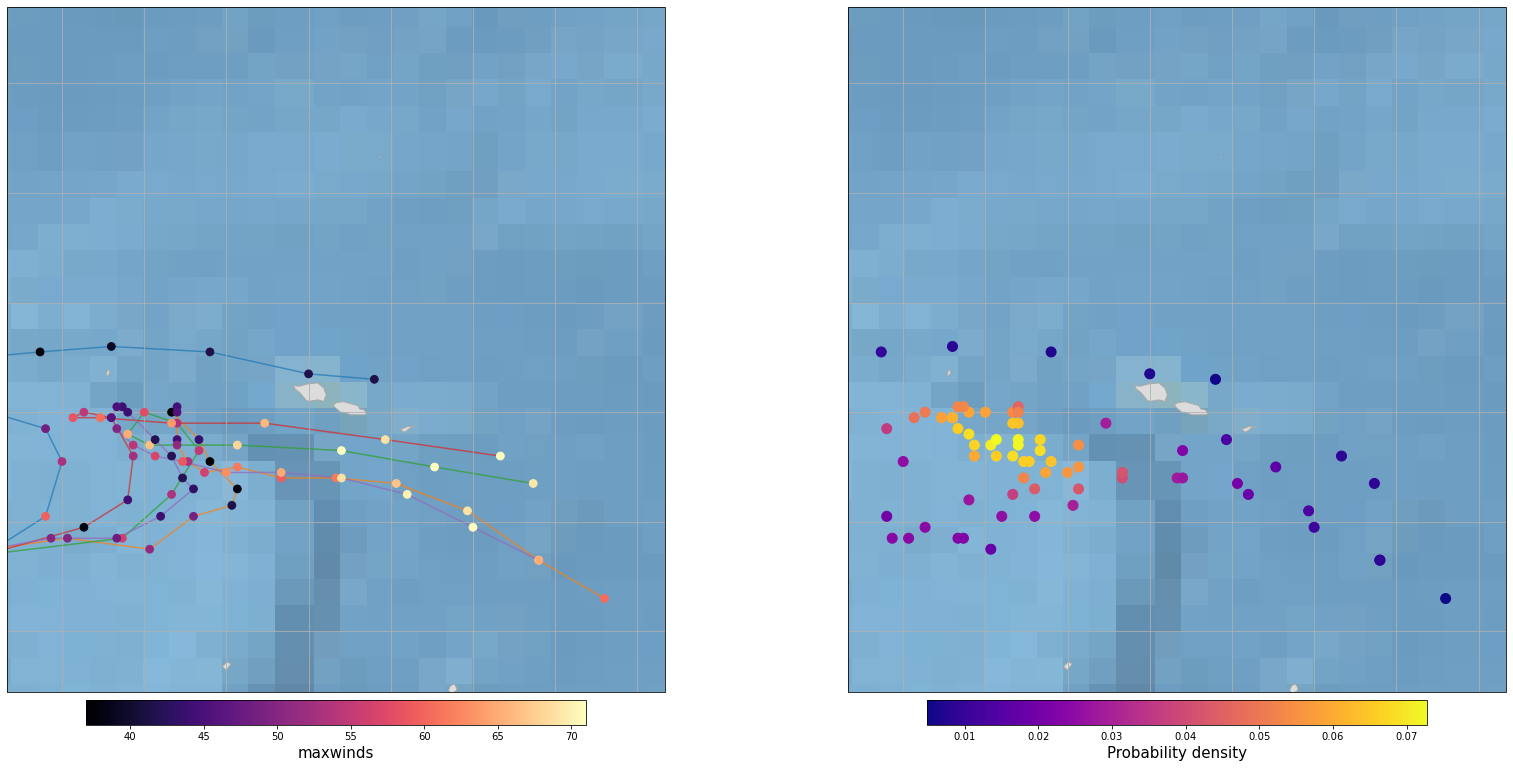
fig = plt.figure(figsize=[30,15]) #30,20
gs = gridspec.GridSpec(1,2,hspace=0.01,wspace=0.01)
ax1 = fig.add_subplot(gs[0],projection = ccrs.PlateCarree(central_longitude=190))
_,_,area=Plot_tracks(TRACKS, var='maxwinds', ax=ax1, fig=fig, area_extent=area_extent)
ax2 = fig.add_subplot(gs[1],projection = ccrs.PlateCarree(central_longitude=190))
Plot_Density_Forecast_Tracks(TRACKS, ax=ax2, fig=fig, area_extent=area_extent, m_size=100)
(<Figure size 2160x1080 with 4 Axes>,
 <GeoAxesSubplot:>,
 [182, 194, -6.6, -19.1])
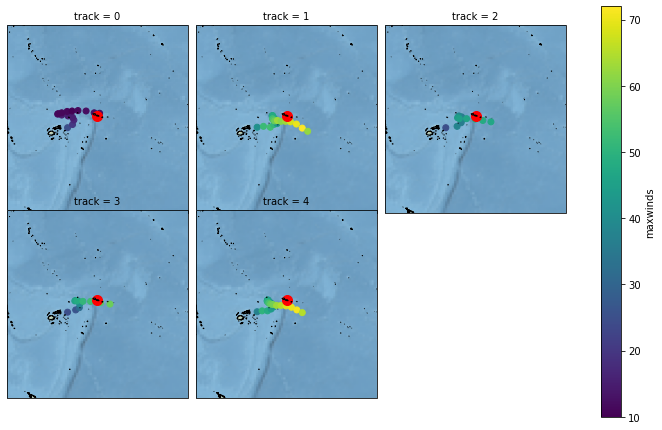
Winds prediction#
p = TRACKS.plot.scatter(
    x='longitude',y='latitude',hue='maxwinds',col='track',col_wrap=3,
    subplot_kws={'projection':ccrs.PlateCarree(central_longitude=180)},
    transform=ccrs.PlateCarree())
for ax in p.axes.flat:
    ax.scatter(*site_center,s=100,c='red',transform=ccrs.PlateCarree())
    ax.coastlines('10m')
    ax.stock_img()
    ext_e = 20 # extra area
    ax.set_extent([site_center[0]-ext_e, site_center[0]+ext_e, site_center[1]-ext_e, site_center[1]+ext_e])
hr_data_recon_tracks = []
vortex_models = []
for track in range(len(TRACKS.track.values)):
    try:
        wind1 = windy(data_path=p_db_winds,
                      site_name=site,
                      site_center=site_center,
                      site_shape=site_shape,
                      tropical_cyclon=TRACKS.isel(track=track),
                      tropical_cyclon_name=f'TRACK {track}',
                      tc_type='forecast',
                      era5_data=xr.open_dataset(p_db_era),
                      hr_wind_data=xr.open_dataset(p_db_hr),
                      postprocess=True,
                      check_correlation=(False,0.8),
                      verbose=True,
                      plot=True)
        vortex_models.append(wind1.vortex_model.expand_dims({'track':[track]}))
        closest_era5_data, hr_data_recon, era5_data_used, scalers_data_used = wind1.calculate_nearest_era5(
            back_cells=3,clos_times=5,scale='custommean',min_M_era5=0,minmax=(0,5))
        hr_data_recon_tracks.append(hr_data_recon.expand_dims({'track':[track]}))
        print(f'TRACK {track} analyzed!!')
    except:
        print(f'TRACK {track} NOT analyzed!!')
 Saving class attributes...


 All data will be saved in /media/administrator/HD1/DATABASES/WRF_Wind    to study the Upolu domain,    which center location is (188.22, -13.92)    and forecast cyclon TRACK 0 will be analyzed!!


 Calculating/saving vortex model...

Done!!

 Plotting vortex model figures...
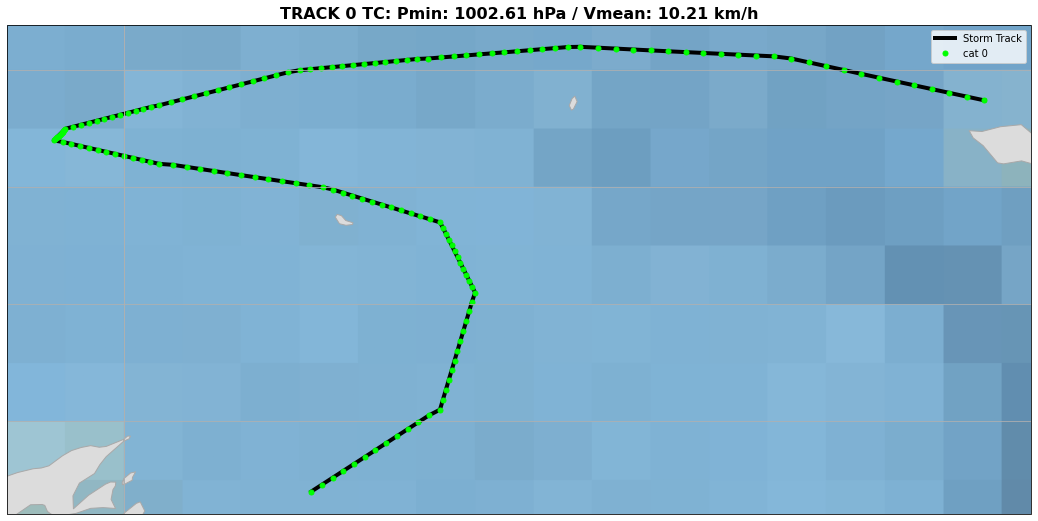
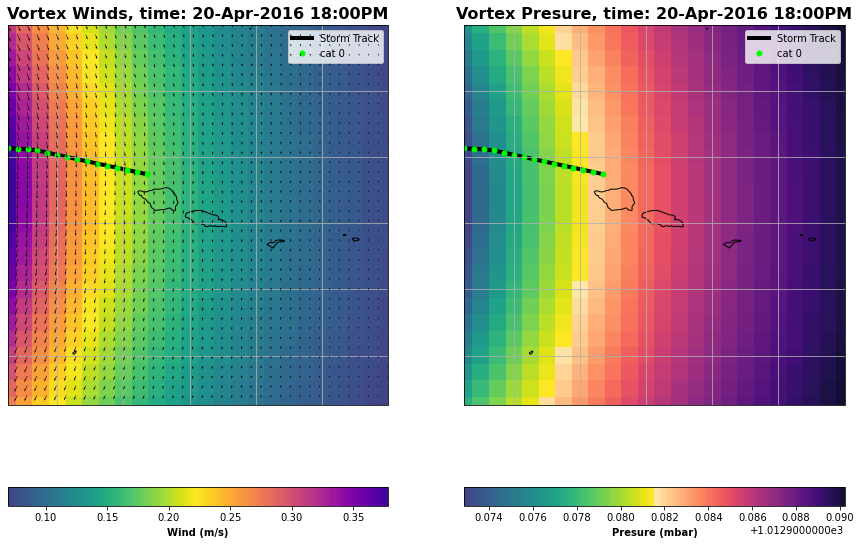
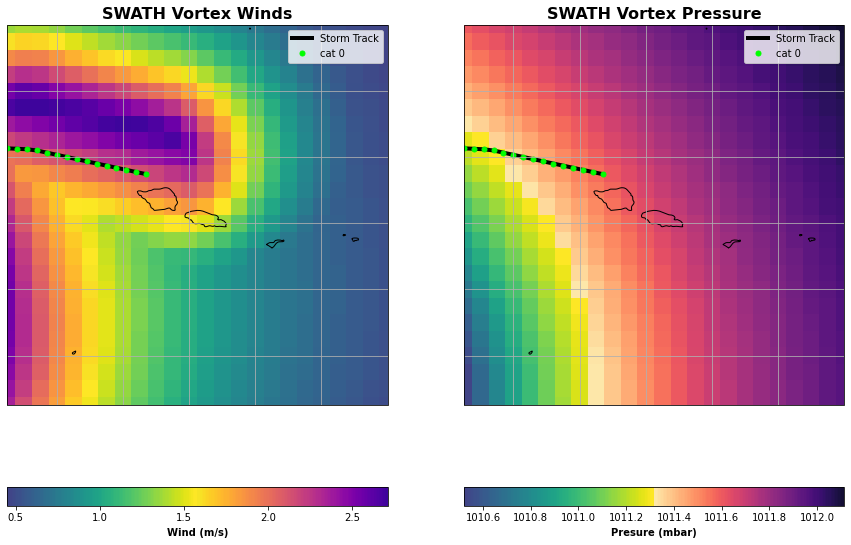
Done!!

 Calculating/saving ERA5 data...

Done!!

 Calculating/saving high resolution winds data...

Done!!

 Post-processing the ERA5 and HR datasets...

Done!!

 Getting the lons/lats to reconstruct the HR winds

Done!!
TRACK 0 analyzed!!

 Saving class attributes...


 All data will be saved in /media/administrator/HD1/DATABASES/WRF_Wind    to study the Upolu domain,    which center location is (188.22, -13.92)    and forecast cyclon TRACK 1 will be analyzed!!


 Calculating/saving vortex model...

Done!!

 Plotting vortex model figures...

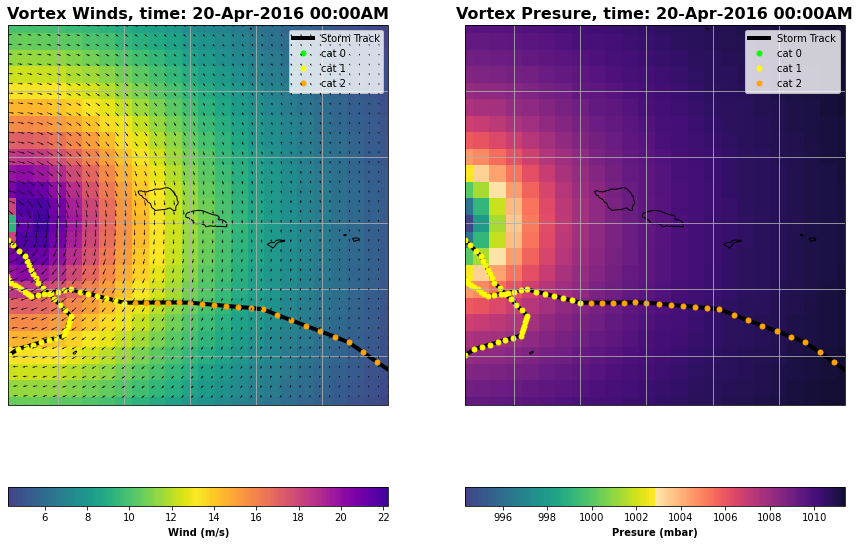
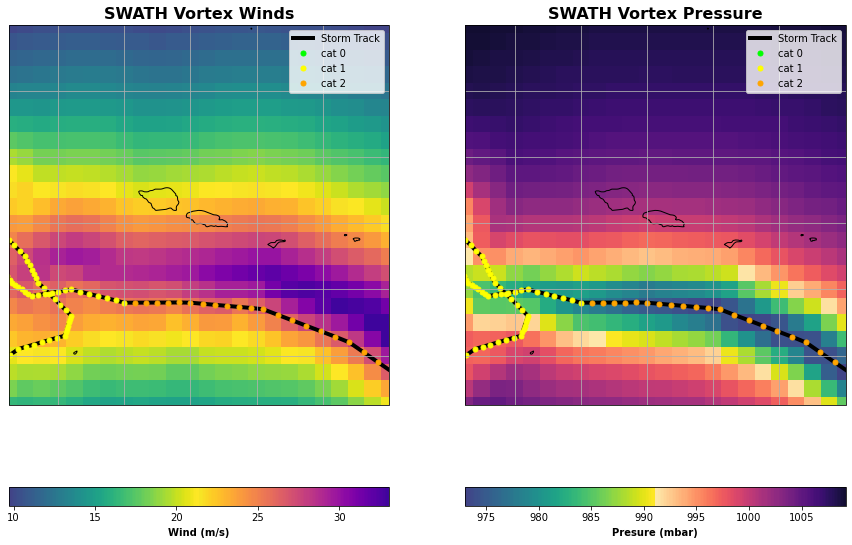
Done!!

 Calculating/saving ERA5 data...

Done!!

 Calculating/saving high resolution winds data...

Done!!

 Post-processing the ERA5 and HR datasets...

Done!!

 Getting the lons/lats to reconstruct the HR winds

Done!!
TRACK 1 analyzed!!

 Saving class attributes...


 All data will be saved in /media/administrator/HD1/DATABASES/WRF_Wind    to study the Upolu domain,    which center location is (188.22, -13.92)    and forecast cyclon TRACK 2 will be analyzed!!


 Calculating/saving vortex model...

Done!!

 Plotting vortex model figures...
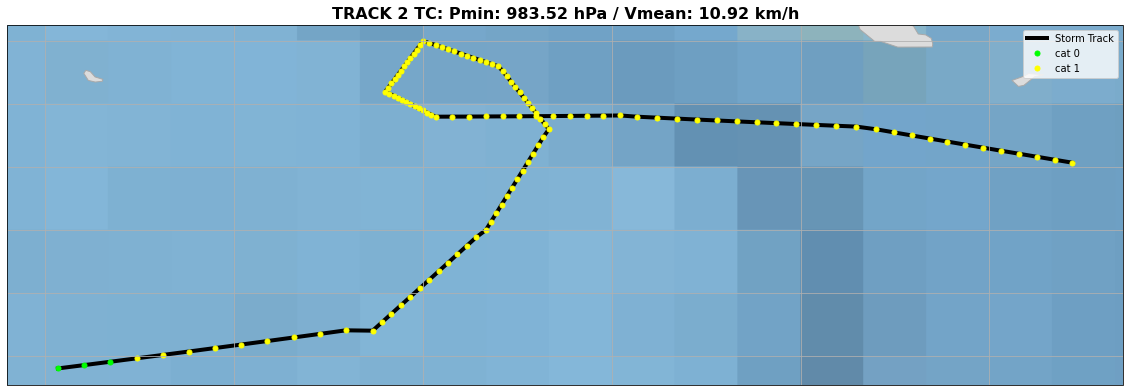
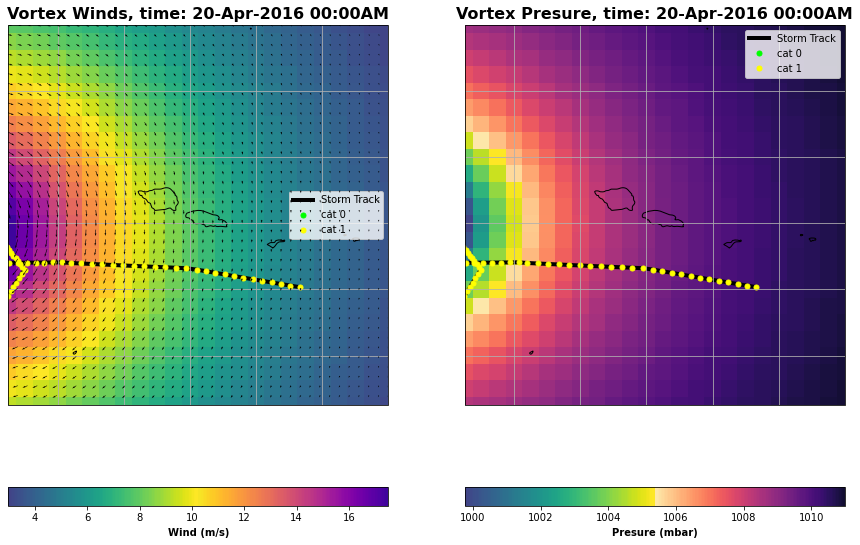
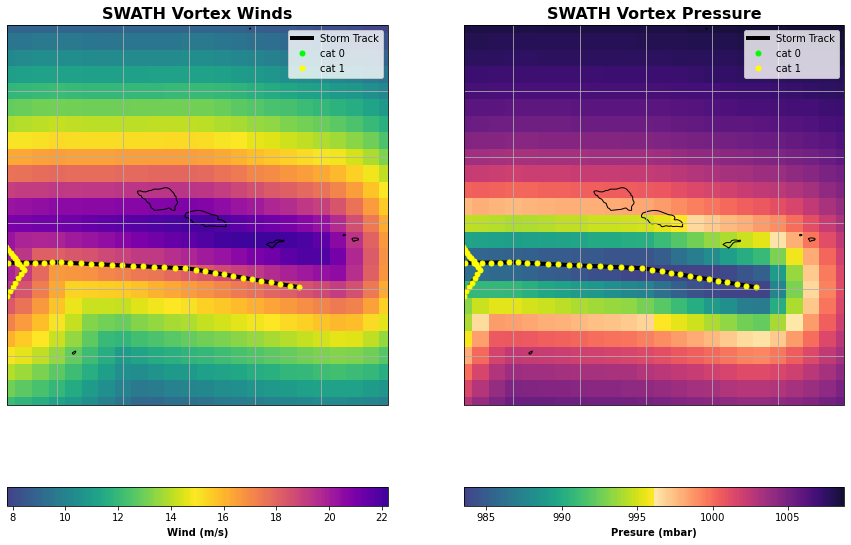
Done!!

 Calculating/saving ERA5 data...

Done!!

 Calculating/saving high resolution winds data...

Done!!

 Post-processing the ERA5 and HR datasets...

Done!!

 Getting the lons/lats to reconstruct the HR winds

Done!!
TRACK 2 analyzed!!

 Saving class attributes...


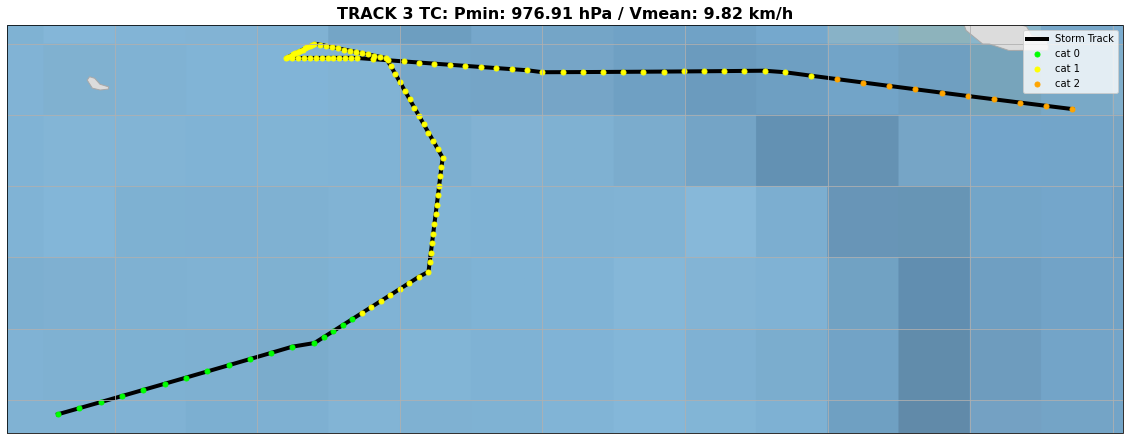
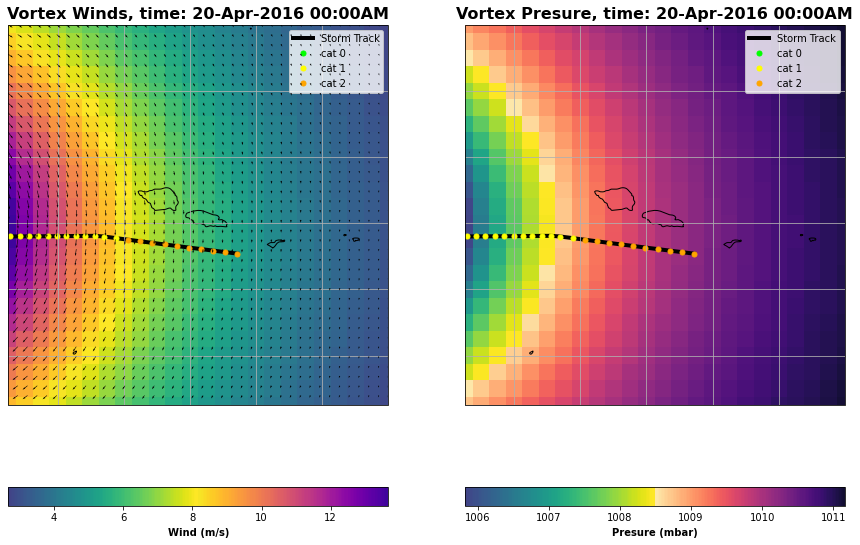
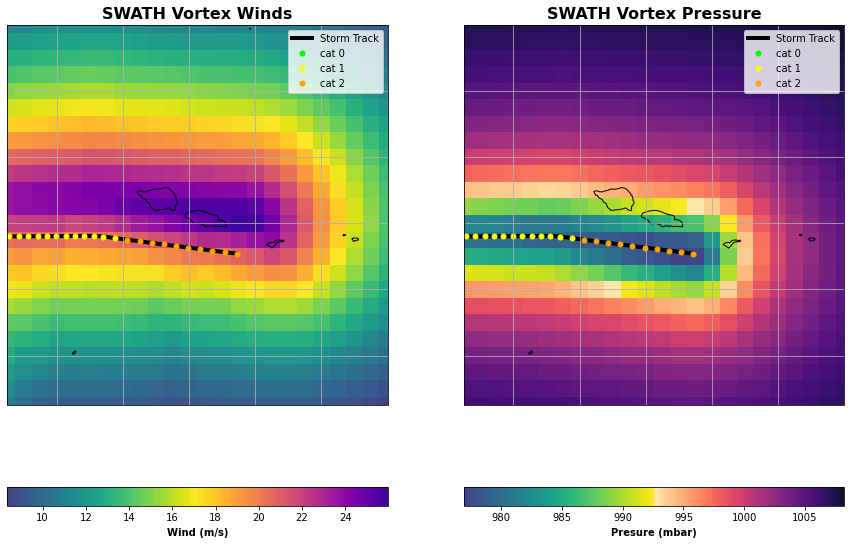
 All data will be saved in /media/administrator/HD1/DATABASES/WRF_Wind    to study the Upolu domain,    which center location is (188.22, -13.92)    and forecast cyclon TRACK 3 will be analyzed!!


 Calculating/saving vortex model...

Done!!

 Plotting vortex model figures...
Done!!

 Calculating/saving ERA5 data...

Done!!

 Calculating/saving high resolution winds data...

Done!!

 Post-processing the ERA5 and HR datasets...

Done!!

 Getting the lons/lats to reconstruct the HR winds

Done!!
TRACK 3 analyzed!!

 Saving class attributes...


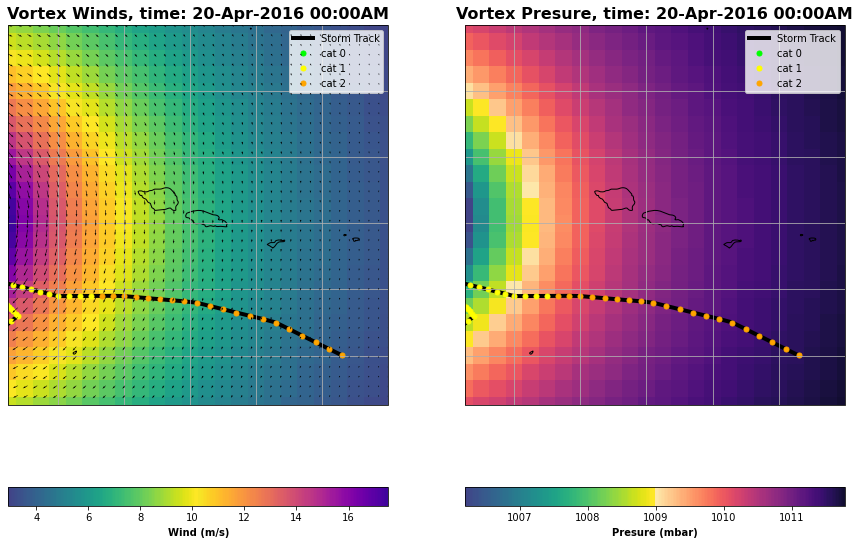
 All data will be saved in /media/administrator/HD1/DATABASES/WRF_Wind    to study the Upolu domain,    which center location is (188.22, -13.92)    and forecast cyclon TRACK 4 will be analyzed!!


 Calculating/saving vortex model...

Done!!

 Plotting vortex model figures...

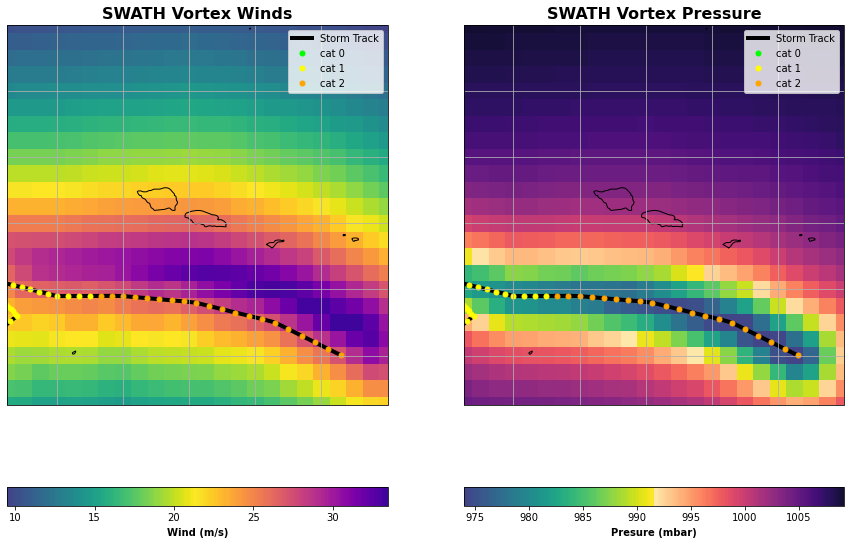
Done!!

 Calculating/saving ERA5 data...

Done!!

 Calculating/saving high resolution winds data...

Done!!

 Post-processing the ERA5 and HR datasets...

Done!!

 Getting the lons/lats to reconstruct the HR winds

Done!!
TRACK 4 analyzed!!
hr_data_recon_all_tracks = xr.concat(hr_data_recon_tracks,dim='track').M.max(dim='time')
vortex_data_recon_all_tracks = xr.concat(vortex_models,dim='track').max(dim='time')
hr_data_recon_all_tracks.to_netcdf(p_hr_tc)
vortex_data_recon_all_tracks.to_netcdf(p_vortex_tc)
hr_data_recon_all_tracks = xr.open_dataarray(p_hr_tc)
vortex_data_recon_all_tracks = xr.open_dataset(p_vortex_tc)
Winds pattern for each predicted Track#
p = np.sqrt(vortex_data_recon_all_tracks.u**2+vortex_data_recon_all_tracks.v**2)\
    .plot(col='track',col_wrap=5,vmin=5,vmax=55,cmap=custom_cmap(100,'plasma_r',0.05,0.9,'viridis',0.2,1),
          subplot_kws={'projection':ccrs.PlateCarree(central_longitude=180)},transform=ccrs.PlateCarree())
for ax in p.axes.flat:
    ax.add_feature(coast_full,facecolor='None',alpha=0.8,edgecolor='black',linewidth=1.5,zorder=5)
    ax.set_extent((182,194,-20,-8))
p = hr_data_recon_all_tracks.plot(
    col='track',col_wrap=5,vmin=5,vmax=45,cmap=custom_cmap(100,'plasma_r',0.05,0.9,'viridis',0.2,1),
    subplot_kws={'projection':ccrs.PlateCarree(central_longitude=180)},transform=ccrs.PlateCarree())
for ax in p.axes.flat:
    ax.add_feature(coast_full,facecolor='None',alpha=0.8,edgecolor='black',linewidth=1.5,zorder=5)
    ax.set_extent((hr_data_recon_all_tracks.lon.min(),hr_data_recon_all_tracks.lon.max(),
                   hr_data_recon_all_tracks.lat.min(),hr_data_recon_all_tracks.lat.max()))


# SAVE one final track for riskscape
raster = hr_data_recon_all_tracks.max(dim='track').to_dataset().rename({'M':'z','lon':'x','lat':'y'}).copy()
raster = raster.rio.write_crs(CRS.from_epsg(4326)).copy()
raster.rio.to_raster(p_final_track_tif)
# Reproject the data using the crs object
raster_rep = raster.rio.reproject(CRS.from_epsg(32702))
raster_rep.rio.to_raster(p_final_track_tif_utm)
raster_rep.rio.to_raster(p_final_track_tif_utm_risk)
SWATH#
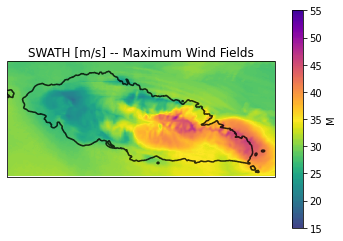
p = hr_data_recon_all_tracks.max(dim='track').plot(
    vmin=15,vmax=55,cmap=custom_cmap(100,'plasma_r',0.05,0.9,'viridis',0.2,1),
    subplot_kws={'projection':ccrs.PlateCarree(central_longitude=180)},transform=ccrs.PlateCarree())
p.axes.add_feature(coast_full,facecolor='None',alpha=0.8,edgecolor='black',linewidth=1.5,zorder=5)
plt.title('SWATH [m/s] -- Maximum Wind Fields')
Text(0.5, 1.0, 'SWATH [m/s] -- Maximum Wind Fields')
Probabilistic assessment#
plot_prob_assessment(vortex_data_recon_all_tracks,
                     hr_data_recon_all_tracks,
                     wind_ths = [15,20,25,30],
                     coast = coast_full,
                     region=(182,194,-20,-8))


