High-Resolution WINDS MetaModel in Upolu
Contents
High-Resolution WINDS MetaModel in Upolu#
Given all the run TCs, the MetaModel proposed reconstructs the high resolution winds provoked by a given tropical cyclone, in the desired island.
To this end, we first calculate the wind fields generated by the cyclone, using Holland et al. 2008, and then, we use an analogues technique to find the closest run TCs in the library of cases.
This is defined in the algorithm and the figure below:
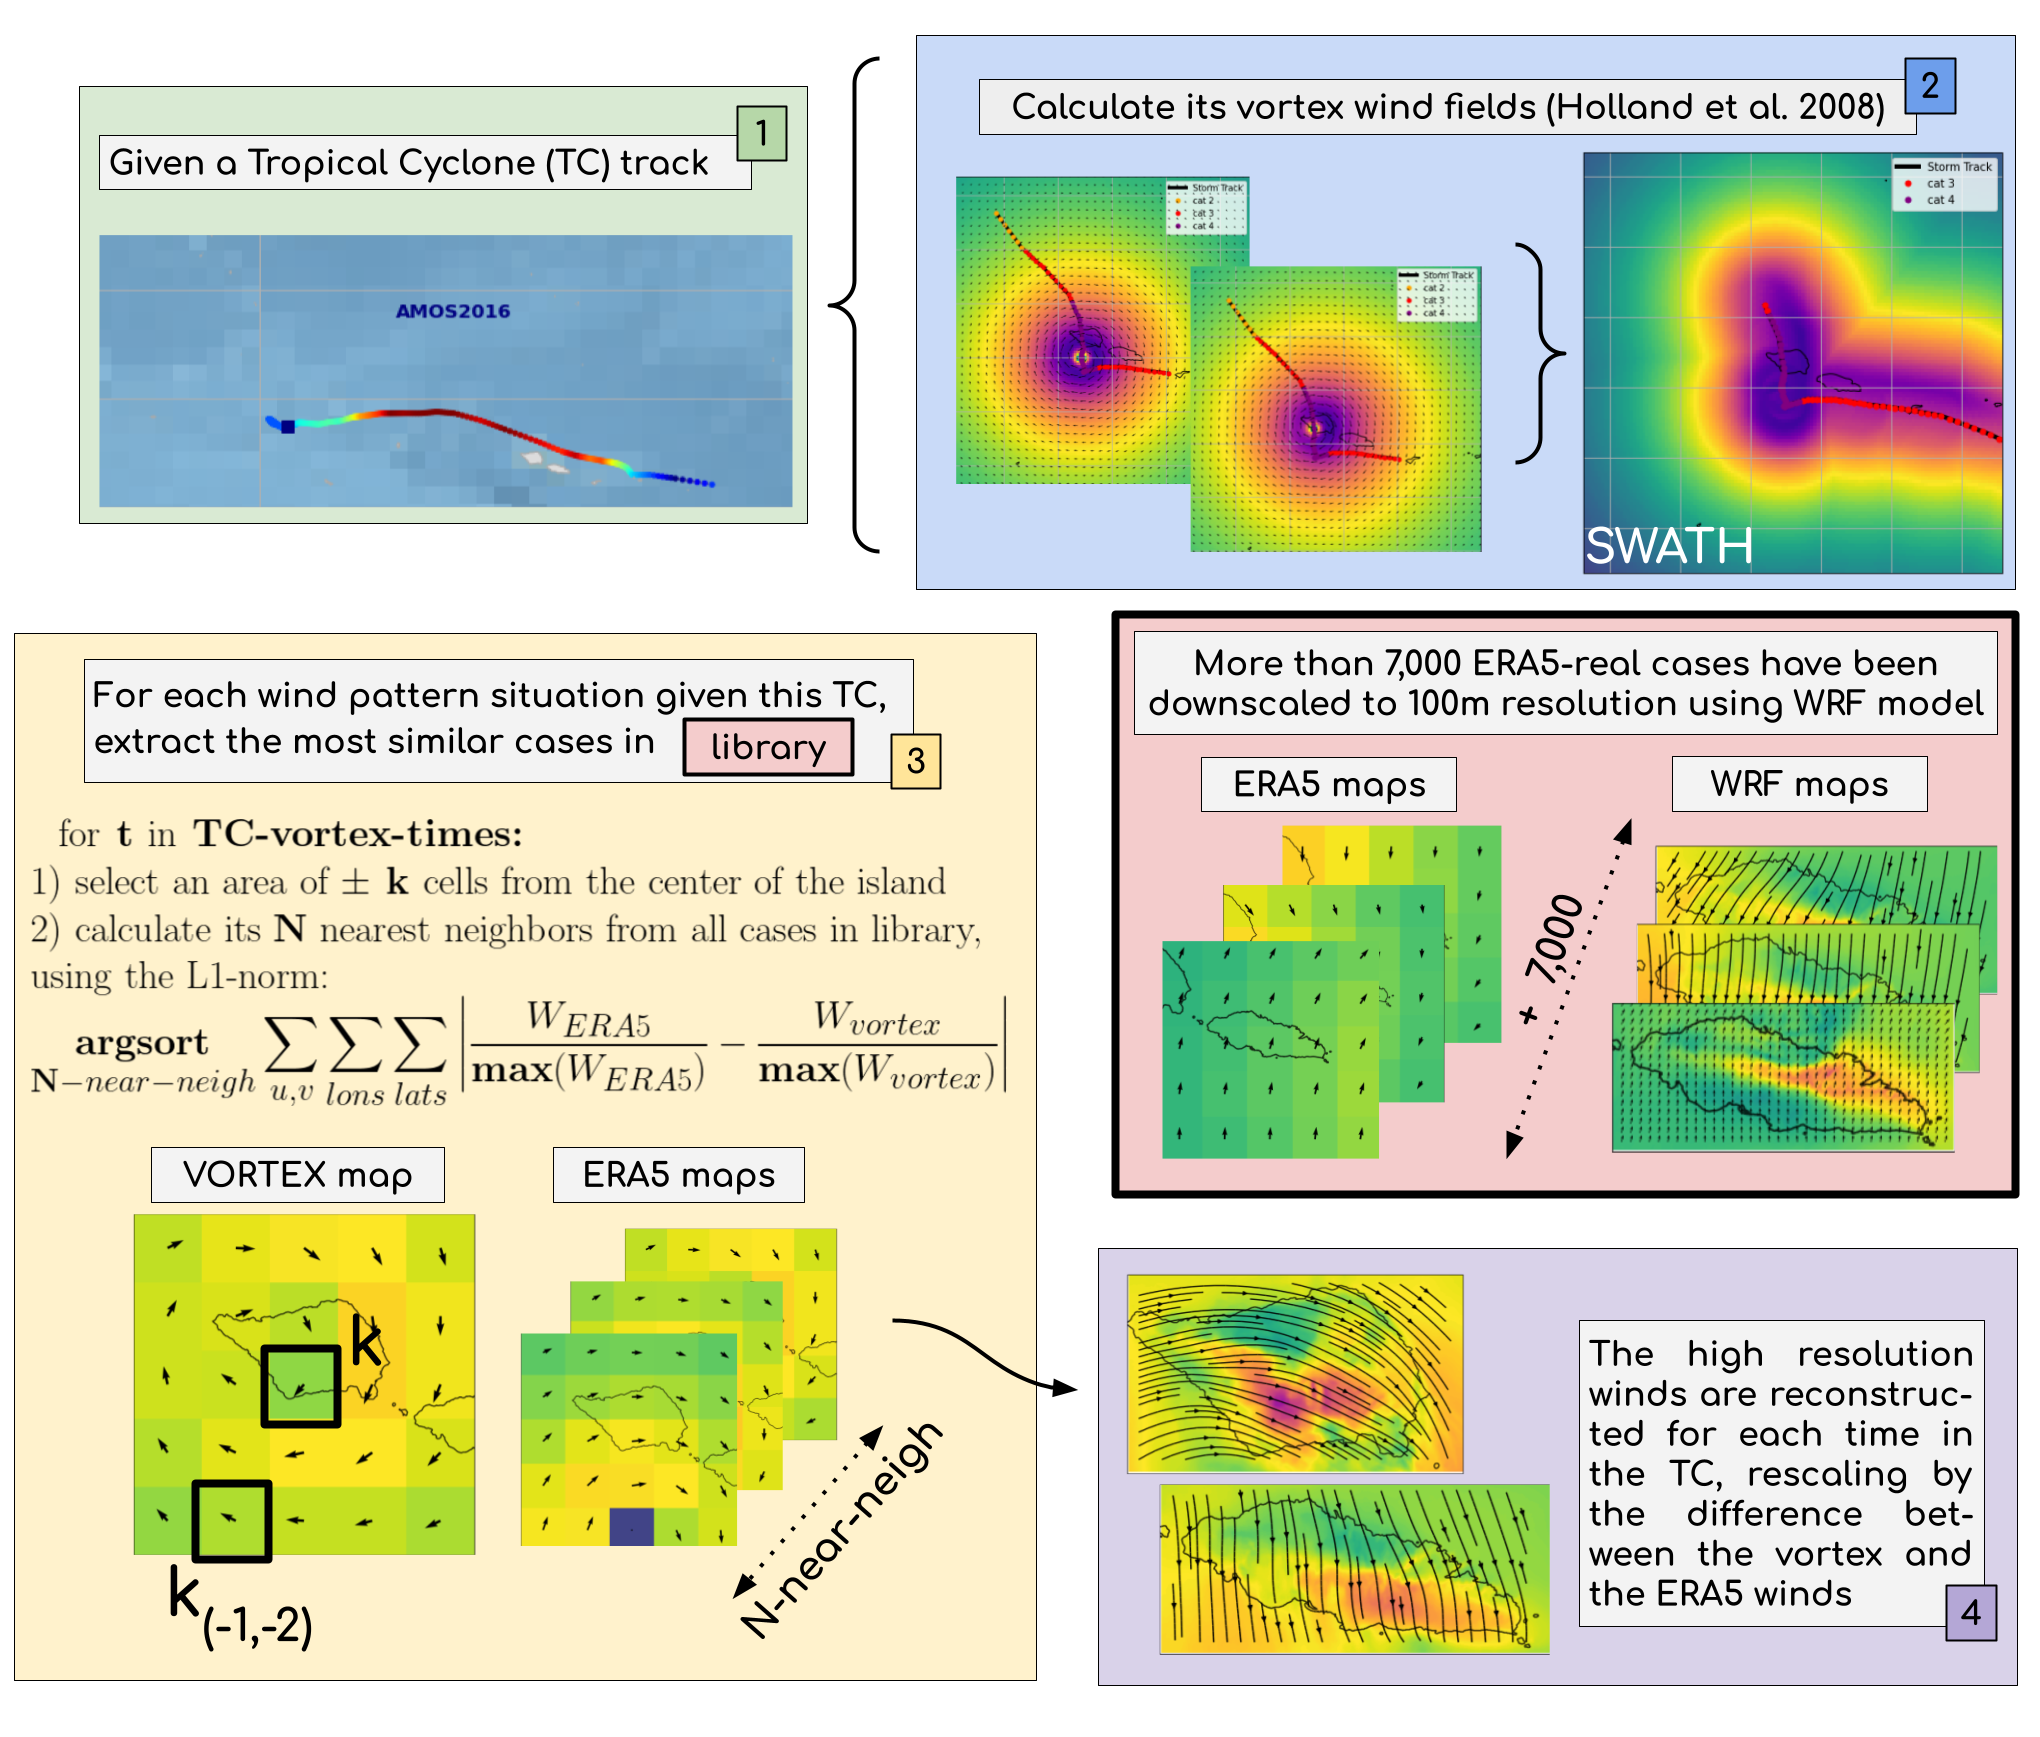
All this is considered in this notebook:
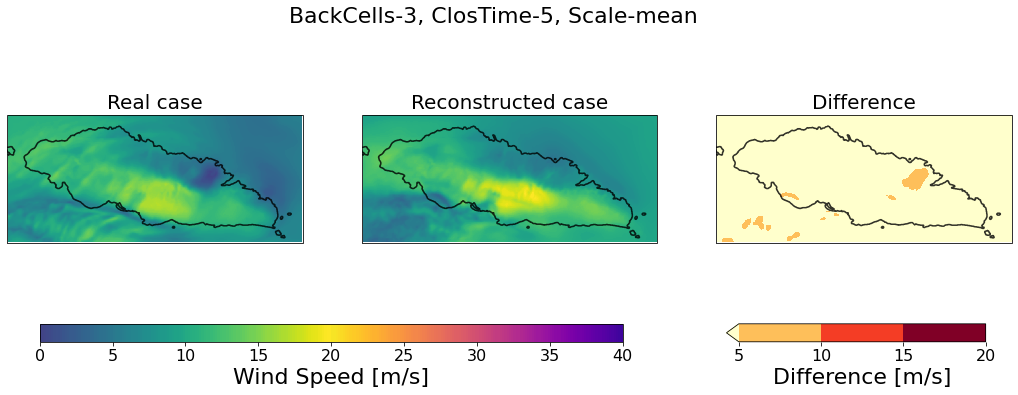
Winds MetaModel is validated
Winds MetaModel example in VAL is shown
Below, the main class used in this MetaModel is shown:
class windy(object):
def __init__(self,
data_path = None,
site_name = None,
site_center = None,
site_shape = None,
tropical_cyclon = None,
tropical_cyclon_name = None,
tc_type: str = 'historical',
tropical_cyclon_processed = None,
vortex_model = None,
era5_data = None,
calc_era5 = False,
hr_wind_data = None,
postprocess: bool = True,
check_correlation: bool = (False,None),
verbose: bool = True,
plot: bool = True
):
but go to src/winds.py for more info!!
Import all libraries#
Below, all the Python libraries used are imported, so please assure this cell runs without errors.
# import warnings
import warnings
warnings.filterwarnings('ignore')
# basics and plotting
import numpy as np
import pandas as pd
import xarray as xr
import matplotlib.pyplot as plt
from matplotlib.patches import Rectangle
import cartopy.crs as ccrs
from shapely.geometry import Point, Polygon
from shapely import affinity as saff
from cartopy.feature import ShapelyFeature
from cartopy.io.shapereader import Reader
from IPython.display import HTML
# custom and bash
import sys, glob, os
import os.path as op
sys.path.insert(0, op.join(op.abspath(''), '..', '..', '..'))
# bluemath modules
from bluemath.winds.winds import windy
from bluemath.winds.geo import degN2degC, degC2degN
from bluemath.winds.plots.plots_greensurge import plot_case_vortex_inputs_WP
from bluemath.winds.plots.utils import plot_metamodel_validation
# database
p_data = r'/media/administrator/HD2/SamoaTonga/data'
site = 'Upolu'
p_site = op.join(p_data, site)
# deliverable folder
p_deliv = op.join(p_site, 'd10_wind_damage')
# path database WRF
p_db = '/media/administrator/HD1/DATABASES'
p_db_winds = op.join(p_db, 'WRF_Wind')
# ERA5
p_db_era = op.join(p_db_winds, 'era5_data', f'era5_data_{site}.nc')
# high resolution
p_db_hr = op.join(p_db_winds, 'hr_wind_data', f'HR_{site}_ALL.nc')
# coast path
p_coast = op.join(p_data, 'gshhg-shp-2.3.7', 'GSHHS_shp', 'f', 'GSHHS_f_L1.shp')
# path tcs 8 degrees radius
p_hist_tcs8 = op.join(p_deliv, 'TCs_r8_hist_samoa.nc')
# Output
p_hist_val = op.join(p_deliv, 'Upolu_experiments_test.nc')
for f in [p_deliv]:
if not op.isdir(f):
os.makedirs(f)
# load the high-resolution coastline for the plots
coast_full = ShapelyFeature(
Reader(p_coast).geometries(),
ccrs.PlateCarree(),edgecolor='black')
Define MAIN model parameters#
As the model can be performed in Tongatapu, Savaii and Upolu, please indicate below where the model is going to be applied. Also the path to the data is selected.
# don't change this code below
if site=='Tongatapu':
site_center = (-175.19+360,-21.16)
elif site=='Savaii':
site_center = (-172.40+360,-13.65)
elif site=='Upolu':
site_center = (-171.78+360,-13.92)
radius = 0.15
site_shape = Point(*site_center).buffer(radius)
# domain_shape = saff.scale(domain_shape,1,0.5)
Validate the MetaModel#
Select the cases to validate#
# get era5 data out of library to validate
max_winds_th = 15 # m/s
random_times_to_validate = 20 # Number of random times to validate
era5_all = xr.open_dataset(op.join(p_db_winds, 'era5_data', f'era5_data_{site}.nc')).copy()
hr_all = xr.open_dataset(op.join(p_db_winds, 'hr_wind_data', f'HR_{site}_ALL.nc')).copy()
common_times = np.intersect1d(era5_all.time.values,hr_all.time.values)
era5_all, hr_all = era5_all.sel(time=common_times), hr_all.sel(time=common_times)
crop_hr_all = hr_all.M[::5,::10,::10]
to_random_times = crop_hr_all.where(crop_hr_all>max_winds_th).dropna(dim='time',how='all').time.values
random_times_pre = np.random.choice(to_random_times,random_times_to_validate, replace = False)
random_times = []
for random_time_pre in random_times_pre:
random_times += list(pd.date_range(
start=str(random_time_pre)[:10],freq='1H',periods=24)
)
print('¡We will select {} cases to validate from the {} cases available over {} m/s!'.format(
np.unique(random_times_pre).size,to_random_times.size,max_winds_th
))
¡We will select 20 cases to validate from the 1157 cases available over 15 m/s!
Initialize the class#
# initialize windy class for VALIDATION
wind1 = windy(data_path=p_db_winds,
site_name=site,
site_center=site_center,
site_shape=site_shape,
tropical_cyclon=None,
tropical_cyclon_name='VALIDATION',
tc_type='historical',
tropical_cyclon_processed = pd.read_csv(op.join(p_deliv, 'VAL_tropical_cyclon_processed_Savaii.csv')),
vortex_model=era5_all.sel(time=random_times_pre).transpose('lat','lon','time').copy(),
era5_data=era5_all.drop_sel(time=random_times).copy(),
hr_wind_data=hr_all,
postprocess=True,
check_correlation=(False,0.6),
verbose=True,
plot=False)
Saving class attributes...
All data will be saved in /media/administrator/HD1/DATABASES/WRF_Wind to study the Upolu domain, which center location is (188.22, -13.92) and historical cyclon VALIDATION will be analyzed!!
Calculating/saving vortex model...
Done!!
Plotting vortex model figures...
Done!!
Calculating/saving ERA5 data...
Done!!
Calculating/saving high resolution winds data...
Done!!
Post-processing the ERA5 and HR datasets...
Done!!
Getting the lons/lats to reconstruct the HR winds
Done!!
Select the parameters of the Analogues technique to study#
# define experiments to test model performance
back_cells_ = [1,2,3]
clos_times_ = [1,3,5,7]
scale_ = ['mean','custommean']
min_M_era5_ = [5]
hr_data_recon_all = []
exp = 1
run = False
if run:
# try all different combinations
for back_cells in back_cells_:
for clos_times in clos_times_:
for scale in scale_:
for min_M_era5 in min_M_era5_:
print(f'Experiment {exp}...')
closest_era5_data, hr_data_recon, era5_data_used, scalers_data_used = \
wind1.calculate_nearest_era5(
back_cells=back_cells,clos_times=clos_times,scale=scale,min_M_era5=min_M_era5
)
hr_data_recon_all.append(
hr_data_recon.expand_dims({'experiment':[exp]}).assign({
'back_cells':(('experiment'),[back_cells]),
'clos_times':(('experiment'),[clos_times]),
'scale':(('experiment'),[scale]),
'min_M_era5':(('experiment'),[min_M_era5])
})
)
exp += 1
all_hr = xr.concat(hr_data_recon_all,dim='experiment')
all_hr.to_netcdf(p_hist_val)
else:
all_hr = xr.open_dataset(p_hist_val)
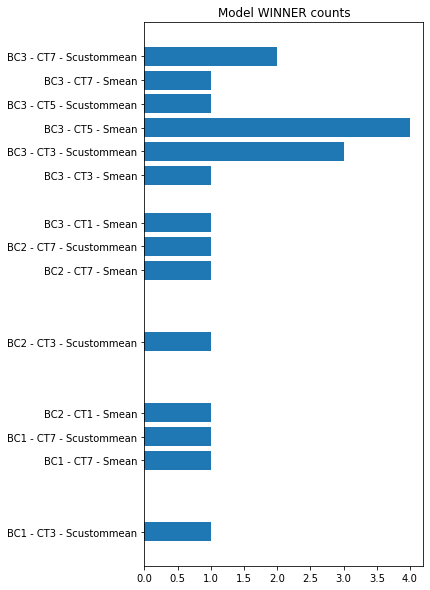
fig, ax = plt.subplots(figsize=(5,10))
best_exps_sorted = np.abs(
all_hr.M-hr_all.sel(time=all_hr.time).M
).max(dim=['lon','lat']).idxmin(dim='experiment').values.astype(int)
best_exps, counts = np.unique(best_exps_sorted,return_counts=True)
ax.barh(y=best_exps,width=counts)
ax.set_yticks(best_exps)
ax.set_yticklabels([
'BC{} - CT{} - S{}'.format(
all_hr.sel(experiment=best_exp).back_cells.values,
all_hr.sel(experiment=best_exp).clos_times.values,
all_hr.sel(experiment=best_exp).scale.values
) for best_exp in best_exps])
ax.set_title('Model WINNER counts')
plt.show()
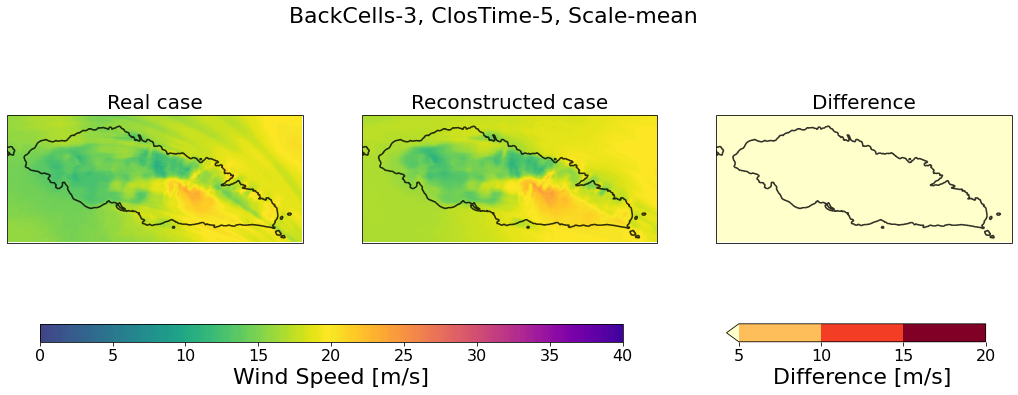
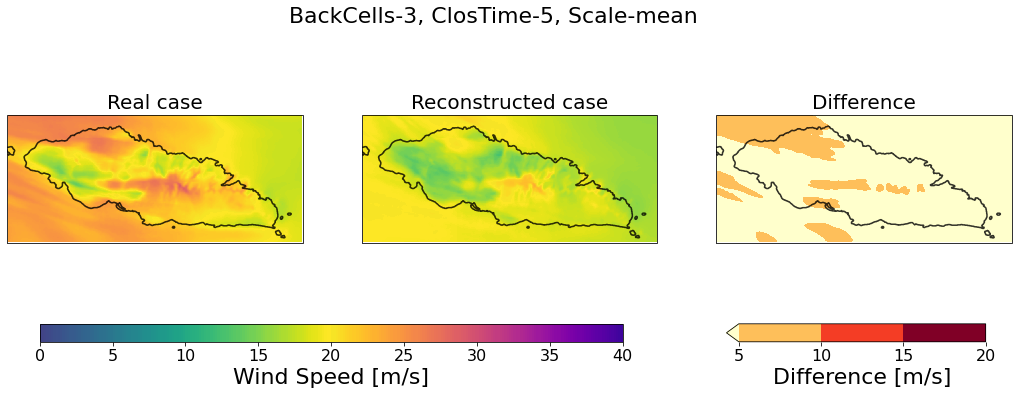
plot_metamodel_validation(
real=hr_all.sel(time=all_hr.time).copy(),
exp=all_hr.isel(experiment=20).copy(),
diff=np.abs(all_hr.M.isel(experiment=20)-hr_all.sel(time=all_hr.time).M),
cases=[8,13,18],coast=coast_full)
Apply MetaModel to TC example#
Select historical cyclone VAL to study#
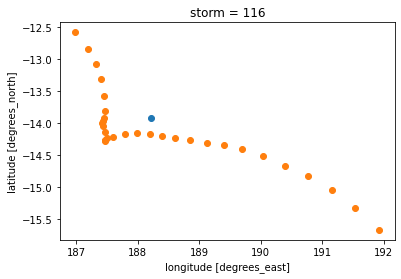
# check name in historical dataset
name = 'VAL'
historical_tcs = xr.open_dataset(p_hist_tcs8)
print(np.where(historical_tcs.name.values.astype(str)==name))
fig, ax = plt.subplots()
ax.scatter(*site_center)
historical_tcs.isel(storm=59,date_time=slice(25,55)).plot.scatter(x='lon',y='lat',ax=ax)
(array([13, 27, 59]),)
<matplotlib.collections.PathCollection at 0x7f89a10d5340>
# and select the cyclone
tropical_cyclon = historical_tcs.isel(storm=np.where(historical_tcs.name.values.astype(str)==name)[0][2],date_time=slice(25,55)).copy()
Initialize the python class for VAL cyclone#
The way this model is coded, everything is built on a class, and below we can initialize it.
# initialize windy class
wind1 = windy(data_path=p_db_winds,
site_name=site,
site_center=site_center,
site_shape=site_shape,
tropical_cyclon=tropical_cyclon,
tropical_cyclon_name=str(tropical_cyclon.name.values),
tc_type='historical',
tropical_cyclon_processed = None,
vortex_model = None,
era5_data=xr.open_dataset(p_db_era),
hr_wind_data=xr.open_dataset(p_db_hr),
postprocess=True,
check_correlation=(True,0.4),
verbose=True,
plot=True)
wind1.add_coast(coast_full) # saved the full resolution coast as a class attribute
Saving class attributes...
All data will be saved in /media/administrator/HD1/DATABASES/WRF_Wind to study the Upolu domain, which center location is (188.22, -13.92) and historical cyclon b'VAL' will be analyzed!!
Calculating/saving vortex model...
Done!!
Plotting vortex model figures...
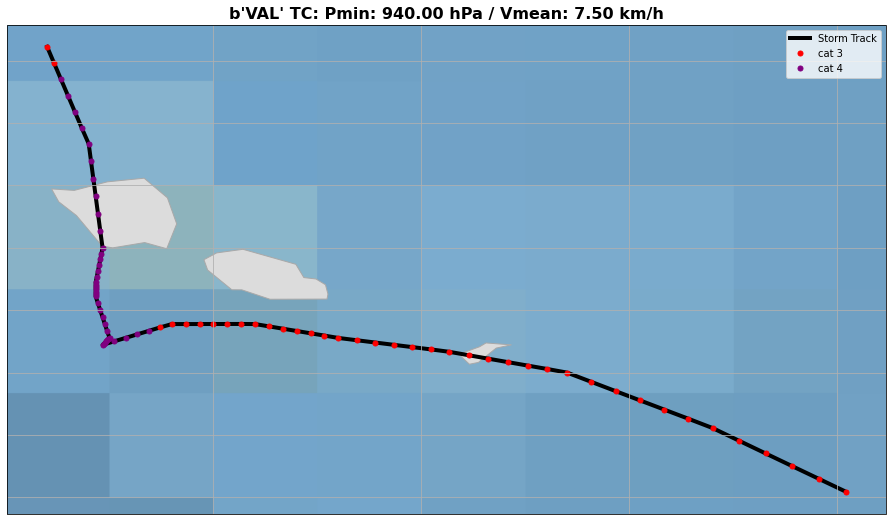
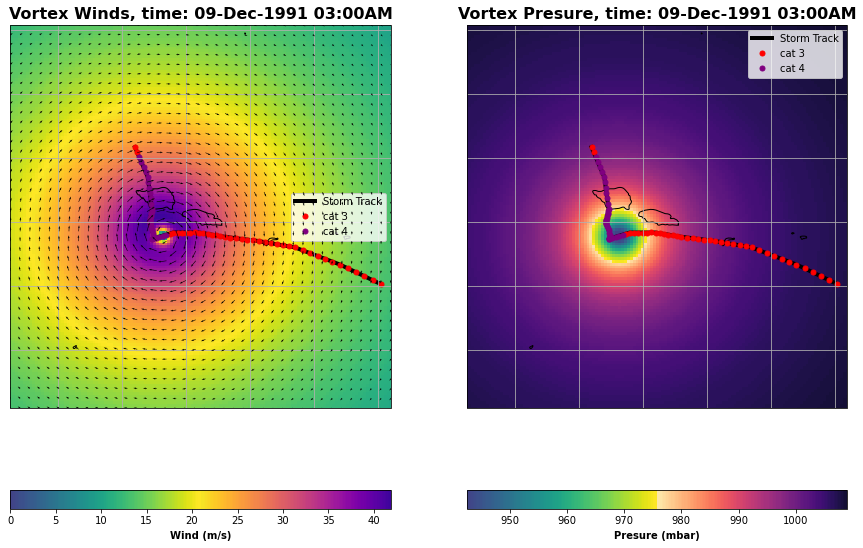
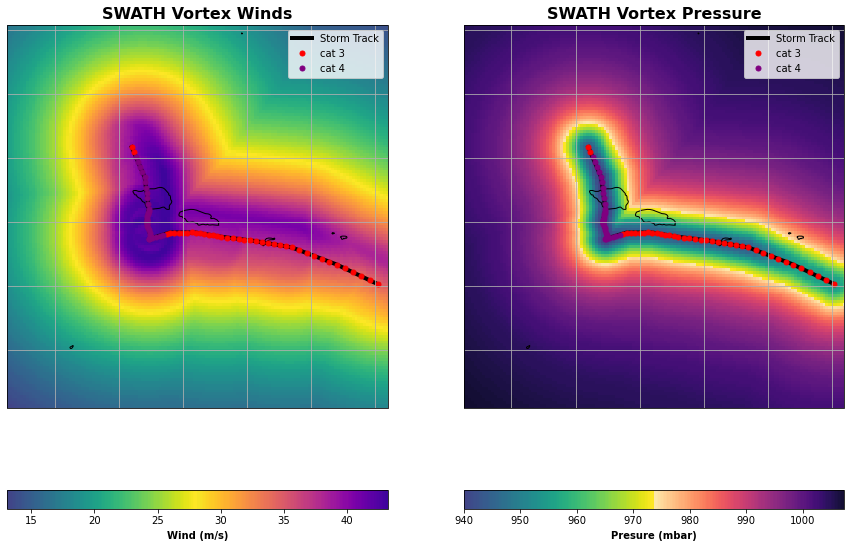
Done!!
Calculating/saving ERA5 data...
Done!!
Calculating/saving high resolution winds data...
Done!!
Post-processing the ERA5 and HR datasets...
Done!!
Getting the lons/lats to reconstruct the HR winds
Done!!
Checking the correlation between ERA5 and HR winds
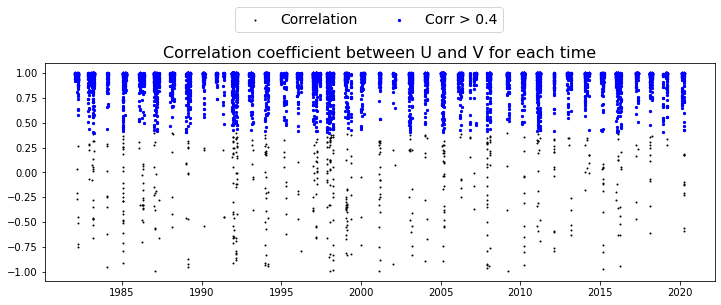
5895 TIMES will be finaly used!!
Done!!
Done!!
# wind1.tropical_cyclon_processed.to_csv(f'../data/cycl_post/GITA_tropical_cyclon_processed_{site_name}.csv')
# wind1.vortex_model.to_netcdf(f'../data/cycl_post/GITA_vortex_model_{site_name}.nc')
wind1.lons_inside, wind1.lats_inside, wind1.idxs_lons_inside, wind1.idxs_lats_inside
([188.25], [-14.0], [161], [172])
Plot vortex wind fields for all the TC times#
ani, fig = wind1.plot_cyclon_information()
generating animation, please wait...
HTML(ani.to_jshtml())
Animation size has reached 21242634 bytes, exceeding the limit of 20971520.0. If you're sure you want a larger animation embedded, set the animation.embed_limit rc parameter to a larger value (in MB). This and further frames will be dropped.
